The Arctic Atmospheric 'Methane Global Warming Veil'. Its Origin in the Arctic Subsea and Mantle
and the Timing of the Global Terminal Extinction Events by 2040 to 2050 - A Review.
and the Timing of the Global Terminal Extinction Events by 2040 to 2050 - A Review.
By Malcolm P.R. Light, Harold Hensel and Sam Carana
June 8th, 2014
Abstract
Methane formed by organisms in the water becomes trapped in the fabric of water ice crystals when it freezes and is stable below about 300 meters depth in the Arctic Ocean and on the shallow East Arctic Siberian Shelf. There are such massive methane reserves below the Arctic Ocean floor, that they represent around 100 times the amount that is required to cause a Permian style major extinction event, should the subsea Arctic methane be released in a short period of time into the atmosphere (Light and Solana, 2012-2014, Carana 2012 - 2014). There are also giant reservoirs of mantle methane, originally sealed in by shallow methane hydrate plugs in fractures cutting the Arctic seafloor (Light 2014, Carana 2013).

The volume transport of the Gulf Stream has increased by three times since the 1940s due to the rising atmospheric pressure difference set up between the polluted, greenhouse gas rich air above North America and the marine Atlantic air. The increasingly heated Gulf Stream, with its associated high winds and energy-rich weather systems, flows NE to Europe where it recently pummelled Great Britain and Europe with catastrophic storms. Other branches of the Gulf Stream then enter the Arctic and heat up the Arctic methane hydrate seals on subsea and deep high-pressure mantle methane reservoirs below the Eurasian Basin-Laptev Sea transition. This is releasing increasing amounts of methane into the atmosphere producing anomalous temperatures, greater than 20°C above average. Over very short time periods of a few days to a few months the atmospheric methane has a global warming potential from 1000 to 100 times that of carbon dioxide (Light 2012 - 2014; Carana 2012 - 2014).
The whole northern hemisphere is now covered by a thickening atmospheric methane veil that is spreading southwards at about 1 km a day and it already totally envelopes the United States. A giant hole in the equatorial ozone layer has also been discovered in the west Pacific, which acts like an elevator transferring methane from lower altitudes to the stratosphere, where it already forms a dense equatorial global warming stratospheric band that is spreading into the Polar regions. The spreading atmospheric methane global warming veil is raising the temperature of the lower atmosphere many times faster than carbon dioxide does, causing the extreme summer temperatures in Australia and the United States. The front of the expanding 1850 ppb Arctic Atmospheric Mantle Methane Global Warming Veil has passed the northern border of the Gulf Coast and is moving south at about 1 km a day and it should totally envelope the Earth by 2048 (Light 2014). Much of this methane is coming from the subsea extreme methane emission zone (Enrico Anomaly) at the transition from the Eurasian Basin to the Laptev Sea which is sourced at an estimated depth of some 112 km in the upper asthenosphere in the Earths mantle (Light 2014). The Earth's mantle methane is being formed in an Arctic "graveyard of subducted plates" by the reactions between the subducted water, carbonate and iron (2) oxide at depths between 100 and 300 km (Light 2014). The 1850 ppb methane cloud will only arrive at the south pole 8 years before mantle methane derived from about 280 km depth (ca 2050) (Light, 2014). These times are similar to the mantle extinction dates derived in this article and from the 420,000 year old ice core data (2052.7)(Light 2014).
During the last winter, the high Arctic winter temperatures and pressures displaced the normal freezing Arctic air south into Canada and the United States, producing never before seen, freezing winter storms and massive power failures. When the Arctic ice cap finally melts towards the end of next year, the Arctic sea will be aggressively heated by the sun and the Gulf Stream. The cold Arctic air will then be confined to the Greenland Ice cap and the hot Arctic air with its methane will flow south to the United States to further heat up the Gulf Stream, setting up an anticlockwise circulation around Greenland. Under these circumstances Great Britain and Europe must expect even more catastrophic storm systems, hurricane force winds and massive flooding after the end of next year, due to a further acceleration in the energy transport of the Gulf Stream. If this process continues unchecked the mean temperature of the atmosphere will rise a further 8°C and we will be facing global deglaciation, a more than 200 feet rise in sea level and a major terminal extinction event by the 2050s.
The United States and Canada must cut their global emissions of carbon dioxide by 80% to 90% in the next 10 to 15 years, otherwise they will be become an instrument of mass destruction of the Earth and its entire human population. Recovery of the United States economy from the financial crisis has been very stupidly based by the present administration on an extremely hazardous "all-of-the-above" energy policy that has allowed continent-wide gas fracking, coal and oil sand mining and the return of widespread oil drilling to the Gulf Coast. This large amount of fossil fuel has to be transported and sold which has caused extensive spills, explosions and confrontations with United States citizens over fracking and the Keystone XL pipeline. Gas fracking is in the process of destroying the entire aquifer systems of the United States and causing widespread earthquakes. The oil spills are doing the same to the surface river run off. The giant pollution cloud over the United States and Canada has speeded up the Gulf Stream by three times since the 1940s. The Gulf Stream carries huge quantities of heat into the Arctic Ocean where it is destabilizing subsea methane hydrates releasing vast volumes of methane into the Arctic atmosphere.
The United States and Canada must now cease all their fossil fuel extraction and go entirely onto renewable energy in the next 10 to 15 years otherwise they will be guilty of planetary ecocide - genocide by the 2050s. There must also be a world-wide effort to capture methane in the subsea Arctic permafrost, ocean and eradicate the quantities accumulating in the atmosphere.
Introduction
Methane formed by organisms in the water becomes trapped in the fabric of water ice crystals when it freezes and is stable below about 300 meters depth in the Arctic Ocean (Light and Solana, 2012). There are such massive methane reserves below the Arctic Ocean floor that they represent around 100 times the amount that is required to cause a Permian style major extinction event, should the subsea Arctic methane be released into the atmosphere (Light and Solana, 2012). There are also giant reservoirs of mantle methane, originally sealed in by shallow methane hydrate plugs in fractures cutting the Arctic seafloor (Light 2014). Unfortunately for us, global warming has heated up the oceanic currents fed by the Gulf Stream flowing into the Arctic, causing massive destabilization of the subsea methane hydrates and fault seals and releasing increasing volumes of methane directly into the atmosphere (Light 2014).
 The methane concentration - temperature correlation from Polar ice core data is graphically illustrated in Figures 1 and 2a from Morrison (2012).
This correlation which goes back to 420,000 years ago shows that when the mean methane content of the atmosphere hit 1.79 ppm/v (1790 ppb) it produced a (delayed) methane eruption induced atmospheric temperature of some 20°C.
This is precisely the temperature of the giant methane-rich clouds that are now circulating the Arctic in 2012 - 2013 (Yurganov, 2013; Carana 2012, 2013) indicating that here, the delayed methane temperature anomaly has already caught up with the Arctic mean atmospheric concentrations (Figure 2b and 2c).
Such a huge Arctic temperature anomaly can only be produced by methane with an apparent Methane Global Warming Potential (GWP) of 1850 times that of carbon dioxide. This is a combined GWP that takes account of a large number of feedbacks caused by other additional methane heating. Recent work by Nuccitelli et al. 2012, in which oceanic global warming was incorporated into the global warming equation, suggests that the 420,000 year old (1850ppb) Methane Global Warming trend, largely represents the effects of oceanic global warming which forms 93.5% of the additional incoming heat.

Assuming a linear rate of temperature increase, a warmer 7.2°C will be achieved by 2052.7, at which time total deglaciation and widespread extinction will occur.
On Figure 2a the upper line represents the 420,000 year old delayed atmospheric temperature versus atmospheric methane concentration profile while the lower line is the projected existing mean atmospheric temperature versus atmospheric methane concentration profile from 1971.3.
The lower line projected from 1971.3 intersects the 8°C, global deglaciation and extinction line at an atmospheric methane concentration of 2230 ppb and the Permian Major Extinction line at an atmospheric methane concentration of 2500 ppb. These two mean atmospheric methane concentrations will be used later in this paper to define the 8°C and Permian extinction events using atmospheric methane concentration data.

Total deglaciation and major extinction will occur after the mean atmospheric anomaly exceeds 8°C (IPCC, 2007) between 2034.5 and 2037.6 while a 10°C anomaly will be achieved between 2039.1 and 2040.1 (Figure 3, Table 3; Carana 2013).
Carana (2014) has generated two histograms for April 2013 and 2014 using IASI MetOp methane data of the mean atmospheric methane content for 9 selected pressures which have been converted to altitude using the US standard atmosphere from Lide and Frederickse, 1995 (Figure 4). These 9 selected points extend up to 18.4 km height in the base of the stratosphere. The predicted linear growth in methane concentration has been determined for each pressure/height level of the expanding Arctic Atmospheric Methane Global Warming Veil to 2100 (Figure 5 and 6). The Methane Global Warimng Veil lies between 7.7 and 18.4 km height with its fastest growing leading edge at an altitude of 9.16 km, which is very close to the mean methane concentration at 9.21 km height (Figures 5 and 6). The date when the 2230 ppb mean atmospheric methane concentration, 8°C temperature anomaly period of major deglaciation and extinction is reached is 2028 (Figure 2a and 5). The date when the 2500 ppb mean atmospheric methane concentration is reached by the Permian Major Extinction event temperature anomaly is 2038 (Figure 2a and 5). Figure 6 shows the very fast expansion of the Arctic Atmospheric Methane Global Warming Veil leading edge at 9 and 11 km altitude between 2013 and 2050, which then penetrates far into Permian Extinction Event, anomalous temperature range, between 2038 and 2050. At the same time there is a predicted slight decrease in the atmospheric methane content below 3.5 km height which may result from the low level methane increasing in buoyancy and rising faster because of the increased heating by the fast growing overlying Methane Global Warming Veil.
Northern Extensions of the Gulf Stream
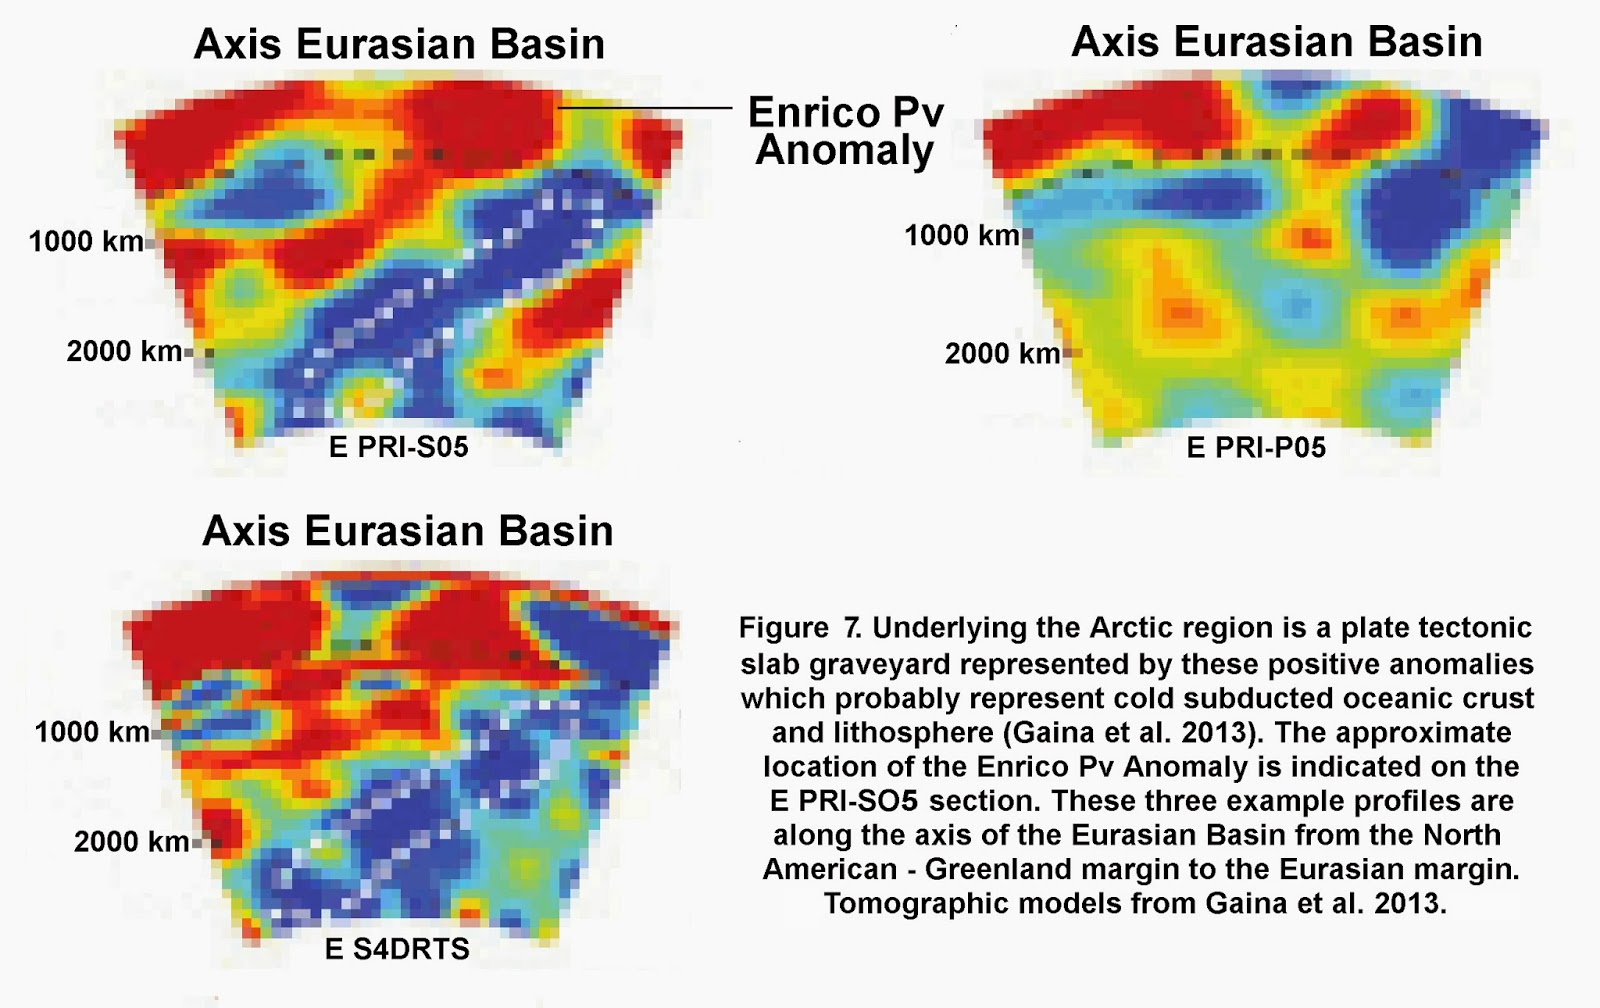
The Gulf Stream (West Spitzbergen Current) follows the southern shelf edge of the Arctic Eurasian Basin to the Laptev Sea, its central hot (+2°C) core zone at 300 meters depth destabilizing the subsea Arctic methane hydrates en route and releasing ever increasing amounts of methane into the Arctic atmosphere (Figures 7 and 8). The extreme and high priority atmospheric emission zones in the Arctic for immediate subsea methane extraction are shown on Figure 7 (Light 2013, 2014).
Linear zones of extreme methane emissions on Figure 7 that occur at right angles to the trend of the Gakkel Mid-Ocean Ridge in the Eurasian Basin are probably methane that is deeply sourced and has entered shear fault systems, some of which represent plate boundary zones (Carana 2014, Light 2014).

Arctic Atmospheric Global Warming Veil
The regional extent of the southward spreading Arctic Atmospheric Global Warming Veil from October 1, 2013 to January 19, 2014 with its leading edge at 9 km to 11 km height is shown on Figure 9 (Carana, 2014). The front of the 1850 ppb Arctic Atmospheric Methane Global Warming Veil has now crossed the Gulf Coast and is moving south at 1 km a day (Light 2014). In the Arctic Ocean the atmospheric methane ranges from 1950 ppb to as high as 2362 ppb (January 19, 2014; Carana, 2014).
 NASA data shows the global methane concentration in the stratosphere, which is the highest at the equator exceeding 1800 ppb (1.8 ppm) and falls of toward the poles (Figure 10).
A giant hole has formed in the hydroxlyl-ozone layer in equatorial S.E. Asia and the west Pacific and allows methane sourced from the 9 - 11 km high leading edge of the southward migrating Arctic Atmospheric Global Warming Veil to rise unimpeded into the stratosphere where it is increasing in concentration (Figure 11a, 10 from Harold Hensel, personal communication, 2014). The high equatorial concentration of methane will be the reason for the extreme "El Nino" this year and the heating extends eastwards to the Gulf Stream enhancing its energy in a giant feedback loop (Figure 11a from Harold Hensel, personal communication, 2014).

The mean speed of horizontal displacement of the stratosphere around the Earth is known to be about 120 km per hour from the 1883 Krakatoa eruption (Heicklen, 1976). Water vapor clouds in the exhaust of the Space Shuttle solid booster were released between an altitude of 46 km and 114 km and were then transferred to the Arctic region in little over a day, although the mechanism of this lateral motion is unknown (Figure 11b and 11c). This water vapor fell from the thermosphere into the colder mesosphere during its northward migration to crystallize as noctilucent clouds (Figure 11d). Mean wind velocities within the global stratospheric methane global warming veil and above it (36 km to 91 km) are some 48 meters per second during the day and 56 meters per second at night (Olivier 1942, 1948).

- A major feedback mechanism is the heat trapping Methane Global Warming Veil sourced from the subsea Arctic methane hydrates which has blanketed the whole of the United States as far south as the Gulf Coast (Figure 9)(from July 2013 - Methanetracker.org). This atmospheric methane veil will further overheat the Gulf Stream thus returning even hotter water back to the Arctic subsea methane hydrate destabilization grounds generating more extensive methane eruption zones (Figures 12a and 12b).
- A second feedback mechanism is caused by the Arctic Ocean ice and Arctic region permafrost which is being degraded severely by atmospheric temperatures around 20°C above normal, especially in Siberia and Alaska. About 90% of the Arctic frozen methane lies in the top 3 meters which is thawing and the temperatures of the river water is rising assisted by high atmospheric temperatures caused by widespread Spring fires. This hot river water flows north into the Arctic ocean where it spills onto the East Siberian Arctic Shelf (ESAS; Shakova et al. 2010, 2013) and into the Beaufort Sea, where it is destabilizing shallow methane hydrates releasing increasing quantities of methane directly into the atmosphere and increasing the concentration of the expanding Arctic Methane Global Warming Veil (Figure 12a, 7, 8). Cenozoic pyroclastic volcanoes also occur on the west end of the ESAS, so destabilization of shallow methane hydrates is probably also opening deep seated, verticle fractures which will allow mantle methane to rise up into the atmosphere (Figures 7 and 8).
- A third major feedback mechanism is formed by a massive hydroxyl (and ozone) hole that has developed in the atmosphere above the western Pacific and Indonesia (Figure 11a)(robertscribbler, 2014). Hydroxyls are nature's air cleaners and they remove air pollution and methane from the atmosphere (Heicklen, 1976). The massive hydroxyl hole in Indonesia allows the southward spreading, 9 km to 11 km high, Methane Global Warming Veil to rise up into the stratosphere where it then returns back at high altitudes to the northern Polar regions to further thicken and increase the warming of the globally spreading methane cloud (Figures 11a, 10, 11b - 11d).
- The massive hydroxyl hole in the atmosphere over Indonesia and the west Pacific also allows the shallow Methane Global Warming Veil to rise vertically into the dense equatorial stratospheric methane belt increasing its concentration (Figure 10). This is probably the source of the El Nino heat build up in the Pacific which is likely to occur in the Summer and Fall where the winds over the warmer ocean have shifted to the east (Figures 12a and 12b).
 The surface temperature off the Coast of the United States in the western North Atlantic shows the flow lines of the warm Gulf Stream (in red on Figure 13c) while colder oceanic zones are in dark blue (Harold Hensel, pers.comm, 2014).
Figure 13b from Csanady (2001) shows the heat gain and loss for the Atlantic Ocean which was posthumously published from Bunker in (1988).
When humans get too hot, their bodies perspire (sweat) water and this water evaporates at a high rate in windy conditions giving them "wind chill".

The excessive heating off the Gulf Stream by pollution clouds pouring off the coast of North America is directly related to excessive heat loss in the same region (Figure 14) because the heat-induced extreme atmospheric pressure change, between the North American polluted air and the Atlantic air, generates very strong winds which "wind chill" the overheated ocean there.
Gulf Stream water temperatures range up to 13°C to 26.5°C (Hurricanes) and water in this temperature range requires about 2440 to 2470 thousand Joules of energy per kilogram for it to change from a liquid into a gaseous state (Latent heat of evaporation; Hyperphysics, 2013; Lide and Fredrickse, 1995). The loss of this latent heat of evaporation is the main reason for the extreme heat loss shown by the hot Gulf Stream waters offshore North America (Figure 14; Ametsoc, 2001).

The spectacular rates of heat loss from the Gulf Stream waters off the coast of the United States can be clearly followed north east to Norway, where they split into the eastern Yermack branch entering the Barents Sea and the West Spitzbergen (Svalbard) Current which dives beneath the floating Arctic Ice Cap (Figure 14 to 17).
This northward pointing tongue of hot and saline Gulf Stream water is clearly visible on the salinity map (Figure 14) as strong inflexions in the contours first west of Ireland and then south of Svalbard just before the Gulf Stream dives beneath the floating Arctic Ice cap as the West Spitzbergen Current (Figure 14 to 17). The ENE trend of the storm bearing winds in the Atlantic sourced from the Gulf Stream offshore North America is mirrored by the ENE trend of extreme climatic rainfall patterns in Europe (Figure 13e).

Extremely high salinity is found in the region of the Enrico Anomaly extreme methane emission zone caused by the larger quantities of atmospheric methane there and its higher heating (global warming) capacity (Figure 15).
The Arctic Ocean slope and deep water methane hydrate regions are shown in Figure 16 (Max and Lowrie, 1993). The subsea slope and abyssal plane methane hydrates are extremely extensive in the Beaufort Sea and along the southern shelf edge of the Eurasian Basin from Svalbard to the Laptev Sea following the trend of the mid-ocean Gakkel Ridge (Figure 16). In the area of the Enrico Anomaly extreme methane emission zone (Area III), the subsea methane hydrates are associated with hydrothermal activity related to the spreading ridge and some of the the methane is more deeply sourced (Figures 16 and 17). High fault concentrations occur at the zones of maximum methane subsea eruptions which coincide with the covergence of the northern extensions of the Gulf Stream (the West Spitzbergen Current and Eastern Yermack branch). These currents intersect at the end of the Eurasian basin, where the Enrico Anomaly extreme methane emission zone occurs at the transition into the Laptev Sea (Figure 17). Gulf Stream waters heated in the Spring and Summer off the coast of the United States, only reach the Arctic Enrico Anomaly maximum emission zone in the Autumn (Fall) and the increase in Arctic methane emissions into the atmosphere generates a False Indian Summer then (Light 2013, 2014).
Vertical Profiles of the Fast Developing Arctic Methane Global Warming Veil
Rising arctic methane emissions are spread by vortices to form an anomalously dense build up of methane in the atmosphere generating a continuously thickening Methane Global Warming Veil now almost enveloping the entire Earth (Figures 18 to 23).
 The progressive rate of growth of the tropospheric Methane Global Warming Veil between 2013 and 2050 (from Carana, 2014) has been combined with the stratospheric methane data trend from Nassar et al. 2005, to show how the data compare (Figures 22 and 23).
The stratospheric methane trend and its variability from Nassar et al. 2005 has then been moved laterally until it forms an extension of the predicted 2050 tropospheric methane trend that has been derived from a histogram created by Sam Carana from IASI MetOp methane data (Arctic-news.blogspot.com) (Figures 22 and 23).
The curves appear to match one another perfectly suggesting that indeed the stratospheric methane concentration between 30 km to 46 km will have surpassed 2000 ppb (2 ppm), which the present Arctic has shown results in temperature anomalies greater than 20°C.
 Consequently, by 2050 total extinction and deglaciation will have occured at temperatures far in excess of those that caused the Permian Major Extinction Event (Wignall, 2009).
Evidence from Lake Chad and the Great Lakes indicates they will all be retreating by 2040. Half of the Qori Kalis Glacier in Peru melted away between 1978 and 2011 and will be entirely gone by the mid 2040s some 5 to 7 years before total deglaciation is expected around 2052.
The meltback is due to a 0.7°C mean temperature increase in the last 70 years - (www.debatepolitics.com). A sharp decline in the ice surface area of glaciers in the Andes became evident in the 1970's and complete deglaciation is expected in the early 2050's (thinkprogress.org)

Estimates of Extinction Times caused by the Growth of the Arctic Atmospheric Methane Global Warming Veil
Three diagrams (Figures 24 to 26) show previously estimated extinction times. Figure 24 defines the zone of methane atmospheric stability versus time for methane released in fountains or torches from destabilized shelf and slope methane hydrates (the Purple, yellow and brown zones). A number of mathematically determined extinction times from various heating curves (now exceeding 40) were made with this and more recent data (see Tables 1 to 5 ; Light 2012, 2013; Carana 2013, 2014). Other possible extinction fields were derived on Figures 25 and 26.

The most recent estimate of the extinction fields is shown on Figure 27 which represents the heating effect of the growing atmospheric Methane Global Warming Veil with its leading edge at an altitude of 9 km to 11 km. The data is derived from the April mean methane readings for selected altitudes (IASI MetOp methane data, Carana, 2014) combined with cut off methane concentrations found on Figure 2a for the 8°C atmospheric temperature anomaly deglaciation and extinction event (2230 ppb) and the Permian Major Extinction event (2500 ppb)(Light, 2014).
We have just got over 14 years of progressively worsening weather with extreme storms before we face the possibility of an Arctic methane induced 8°C atmospheric temperature rise with associated global deglaciation and extinction (Figure 27). An extinction event equivalent to the Permian Extinction is expected to begin by 2038 to 2040 and last through to 2065 (Figure 27).

Moving average graphs of 40 extinction time estimates on Figure 28a show a very close correlation with 8 and 10 degree extinction times estimated from Sam Carana's Accelerated Arctic Warming and Runaway Global Warming trends (2034 - 2040 from Carana, 2013). This early extinction event is largely a result of the destabilization of subsea Arctic methane hydrates from globally heated Gulf Stream waters and increasing seismic activity (Light, 2013, 2014; Carana, 2013, 2014). A later peak at 2047 to 2053 correlates exactly with the extinction time estimates for extreme mantle emission rates from the Enrico Anomaly located at the transition of the Eurasian Basin to the Laptev Sea (Figure 28a, Light, 2014). This methane is sourced from the Earth's mantle at depths of 100 km to 300 km (Light, 2014). In addition the 420,000 year ice core (Morrison, 2013) delayed methane atmospheric 8°C temperature anomaly extinction event lies at the high end of this range (Figure 28a).
The smoothed extinction curve climbs shallowly from 2011 which corresponds to the start of major Arctic emissions (e.g. Svalbard) and then rises steeply from 2015 which represents the time of the start of the melt back of the Arctic sea - ice, extreme weather events and sea level rise (Figure 28a). On the 16th November, 2010 (2.04 ppm) a huge sudden atmospheric spike like increase in the concentration of atmospheric methane occured at Svalbard north of Norway in the Arctic reaching 2040 ppb ESRL/GMO, 2010 - Arctic - Methane - Emergency - Group.org). The cause of this sudden anomalous increase in the concentration of atmospheric methane at Svalbard has been seen on the East Siberian Arctic Shelf where a recent Russian - U.S. expedition has found widespread, continuous powerful methane seepages from the subsea methane hydrates into the atmosphere with the methane plumes (fountains or torches) up to 1 km across producing an atmospheric methane concentration 100 times higher than normal (Connor, 2011). The two reversals after 2026 and 2036 may be due to global energy loss caused by the latent heat of melting of the thawing ice (Figure 28a). Extinction estimates from Accelerated and Runaway Global Warming are shown on Tables 3, 4 and 5.

GISS Maximum Monthly Global Temperature Anomalies
Figure 28b shows the NASA GISS maximum monthly global temperature anomalies derived from GISS data maps (NASA 2012). The total number of monthly GISS means of the anomaly maxima plotted on Figure 28b is 743. The extremely high maximum temperature anomalies of 13 to 16 between 1957 and 1981 are from the Antarctic region and probably represent atmospheric methane concentration peaks caused from the destabilization of methane hydrates by early warming of the submarine slope regions.

It is evident from Figures 28b that the long periods of freezing followed by shorter thaw periods have been getting progressively shorter and occur at higher maximum temperature anomalies in each of the succesive cycles. The length of each of the freezing cycles has shrunk from 20 years (1960 - 1980) to about 2 years (2004 - 2006) while the mean value of the 11 year moving average temperature anomaly has climbed from 5.5°C to ca 6.75°C.
The range of the intersection points of the converging data set runs from 2011.363 (July anomaly temperature 6.7079°C) to 2022.989; June anomaly temperature 7.1414°C (Table 6). The mean intersection point from the 12 convergent data sets, which represents the best estimate of the time when the Arctic floating sea ice cap will be completely melted away is 2015.757 (Figure 10. October 2 anomaly temperature 6.8762°C). The 2015.757 best estimate for when the Arctic floating sea ice will be completely melted away is almost identical to the 2015 -2017 date suggested by PIOMAS ice volume reduction data (Wipneus 2012) and is within its 90% confidence interval error limit. The calculated time of the GISS convergent field 8°C atmospheric temperature anomaly causing global deglaciation and extinction is fixed at 2041.2473 (Table 6). This is almost identical to the time when the linear extrapolation of the Arctic sea ice mean thickness reaches zero at 2040.31 (after Kwok and Rothrock, 2009).
The World's Oceans Absorb 93.5 Percent of the Human Induced Global Warming Energy
 Human induced global warming, caused by the burning of fossil fuels, is found to be continuous when the ice, land and atmosphere heating data (Church et al. 2011) are combined with the 5 - year average ocean heat content, to a depth of 2000 meters (Levitus et al. 2012)(Figure 29a. Nuccitelli et al. 2012).
The lack of incorporation of this data in the global warming equation by the IPCC, is the reason for the extreme 50 year error found in estimating the floating Arctic ice cap melt time using global atmospheric models as discussed in previous papers (Figures 29a and 29b; Light 2012, Light 2013).
This is because the floating Arctic ice cap is mostly being melted from underneath by globally heated ocean waters, as are the Greenland and Antarctic glaciers (Trenberth, 2014).
As a result the rate of melting of the Antarctic ice sheet has doubled to 159*10 power 9 tonnes per year since Cryosat started first measuring it in 2010 (CPOM, 2014). The rate of increase of global warming heat is equivalent to 8 x ten to the power of 21 joules per year (Nuccitelli et al. 2012).
 This amount of carbon dioxide added to the atmosphere by human fossil fuel burning is equivalent to about 700 Pinatubo - size eruptions per year and the rate of heat input is equal to four Hiroshima atomic bomb detonations every second (Nuccitelli et al. 2012; SkepticalSceince, 2012; USGS 2014).
Human pollution and what it triggers has completely over-run nature's natural cycle and balance (Harold Hensel, personal communication, 2014).
The ocean has absorbed 93.4 percent of the heat from global warming, while the atmosphere only 2.3 percent and the surface of the floating Arctic ice cap 0.8 percent (Figure 29b, ACS 2013). The total amount of heat generated by human induced global warming between 1990 and 2010 is some 14 x ten power 22 joules which is equivalent to an absorbed energy flux of 2.2 x ten power 14 watts, i.e about 0.5 watts per square meter of the earth's surface (ACS 2013).
It is now clearly evident that the floating Arctic sea ice cap and the Greenland and Antarctic glaciers are almost entirely being melted from below by the globally warmed ocean waters because 93.4 percent of the global warming heat energy is going into the oceans (Figure 29b).
 The atmosphere and Arctic sea ice together only absorb 3.1 percent of the global warming heat (Figure 29b). Consequently the rate of floating Arctic ice cap melting will be increased by a amount approximately equivalent to the ratio of the oceanic heat intake (93.5%) to that of the atmosphere and Arctic sea ice heat intake combined (3.1%), ie by 30.129.
Consequently the meltback will occur in 1/30th of the time than was originally predicted by the IPCC modelling studies (Figure 29c). The IPCC models predicted that the floating Arctic ice cap would first begin to melt around 2100, 86 years after 2014 (Figure 29c). The time of the first Arctic sea ice melt back must now be shortened to 86/30.129 = 2.85 years, i.e. by 2016.85 consistant with the PIOMAS exponential ice melt back time estimates (Light 2013, 2104).
 |
| Figure 29d. Arctic sea surface temperature anomaly, June 8, 2014. From: Arctic Sea Ice Steep Decline Continues |
The Giant Unsustainable Carbon Footprint per Unit Population of the United States and Canada and its Catastrophic Environmental Effects
Figure 30 show the yearly north - eastward Gulf Stream transport of the energy (watts) from the North Atlantic Sub - Tropical Gyre to the Arctic Ocean. The map uses Gulf Stream flow volumes in Sverdrups (= one million cubic meters/second) calibrated to the heat flow trend from eight measured heat flow values along the Gulf Stream (Csanady, 2001). The calibration constant is 3.85 x ten to the power of 7. The heat flow data comes from Csanady, 2001; Gulf Stream flow volumes from Sverdrup, Johnson and Fleming, 1942, Wales J., 2013 and the University of California, (CDL, 2013).
The Gulf Stream shows a zone of anomalously large global warming heating, extremely high rates of South Westerly wind induced ocean current flow, extreme wind chill (caused by evaporation of the sea surface) and elevation of the surface of the Gulf Stream along the coast of the industrialized United States and Canada (Figure 30). Quite clearly the global warming caused by pollution clouds pouring off the coast of the industrialized United States is generating a large air pressure differential, accelerating and heating the prevailing South Westerly Wind flow with its consequent wide ranging effects on the Gulf Stream seen as far north as the Central Arctic (Figure 30). As mentioned previously this global warming has increased the rate of water transport from 55 Sverdrups in 1942 to up to 150 Sverdrups at the present (Sverdrup et al. 1942, Wales, 2013).
The heat necessary to liberate methane from the methane hydrates in the Arctic Ocean and cause runaway global warming, total deglaciation and extinction in 2052 represents only one thousandth of the total amount of heat being added to the Arctic ocean by the Gulf Stream (Thick black line at right bottom of Figure 30). The Yermack Current (E. extension of the Gulf Stream) in the Barents Sea intersects the West Spitzbergen Current (W. extension of the Gulf Stream) at the junction of the Eurasian Basin/Laptev Sea (Figure 30). This represents a region of extreme subsea - atmospheric methane emissions (The Enrico Anomaly) in a zone of hydrothermal methane hydrates formed above the spreading Gakkel oceanic ridge where it enters the Laptev Sea - shelf region (Light 2013).

The total carbon dioxide emitted by each country is proportional to the size of the circles (Figure 31).
The United Kingdom emitted the most carbon dioxide per person at the start of the industrial revolution, but the United States caught up with the U.K. at the start of the 20th century (Figure 31).
From then on the U.S.A. grew to be the largest emitter of carbon dioxide (Figure 31). An average U.S. citizen causes 3 times as much carbon dioxide to be emitted (19 tons of carbon dioxide/person) than a person in China (4.7 tons of carbon dioxide/person)(Figure 31).
China however due to its large population emits a lot of carbon dioxide in total, but so does Europe as a whole (Figure 31). 5 states, the United Arab Emirates, Saudi Arabia, Australia, U.S.A. and Canada have the most extreme human carbon footprints on Earth (Figure 31)(Light, 2013).
Our Only Hope for Survival
The power, prestige and massive economy of the United States has been built on cheap and abundant fossil fuels and Canada is now trying to do the same. The present end of the financial crisis and recovery of the U.S. economy will take us down the same fossil fuel driven road to catastrophe that the U.S. has followed before. Unless the United States and Canada reduce their extreme carbon footprints (per unit population)(Figure 31), they will end up being found guilty of ecocide and genocide as the number of countries destroyed by the catastrophic weather systems continues to increase.
The United States and Canada with their expanding economies and their growing frenetic extraction of fossil fuels, using the most environmentally destructive methods possible (fracking and shale oil) as well as the population's total addiction to inefficient gas transport is leading our planet into suicide. We are like maniacal lemmings leaping to their deaths over a global warming cliff. The U.S. Government and Canada must ban all environmentally destructive methods of fossil fuel extraction such as fracking, extracting tar sands and coal and widespread construction of the now found to be faulty hydrocarbon pipeline systems. All Federal Government subsidies to fossil fuel corporations, for fossil fuel discovery and extraction must be immediately eliminated and the money spent solely on renewable energy development, i.e converting all the US coal power stations to solar energy which will then provide many jobs to the unemployed coal miners once they have been trained. This will allow the US and Canada to cut their global emissions of carbon dioxide by 80% to 90% in the next 10 to 15 years, otherwise they will be become an instrument of mass destruction of the Earth and its entire human population. All long and short range (high consumption) fossil fuel transport must be electrified and where the range is too large, electrical trains must be used instead of trucks for transport. All the major work for this conversion and railway construction can provide a new and growing set of jobs for the unemployed. Nuclear power stations must continue to be used and should be converted to the safe thorium energy system until the renewable energy transition is complete.
The U.S. has to put itself on a war footing, recall its entire military forces and set them to work on the massive change over to renewable energy that the country needs to undertake, if it wishes to survive the fast approaching catastrophe. The enemy now is Mother Nature, who has infinite power at her disposal and intends to take no prisoners in this very short, absolutely brutal, 30 to 40 year war she has begun. I cannot emphasize more, how serious humanity’s predicament is and what we should try to do to prevent our certain final destruction and extinction in the next 30 to 40 years if we continue down the present path we are following .
The volume transport of the Gulf Stream has increased by three times since the 1940s due to the rising atmospheric pressure difference set up between the polluted, greenhouse gas rich air above North America and the marine Atlantic air. The increasingly heated Gulf Stream, with its associated high winds and energy rich weather systems, flows NE to Europe where it recently pummelled Great Britain and Europe with catastrophic storms. Other branches of the Gulf Stream then enter the Arctic and heat up the Arctic methane hydrate seals on subsea and deep high - pressure mantle methane reservoirs below the Eurasian Basin- Laptev Sea transition (Figure 17). This is releasing increasing amounts of methane into the atmosphere and producing anomalous (global warming) temperatures, greater than 20 degree C above average (Figures 2a and 2b). Over very short time periods of a few days to a few months the atmospheric methane has a global warming potential from 1000 to 100 times that of carbon dioxide (Figure 2a. and 24)
There are such massive reserves of methane in the subsea Arctic methane hydrates, that if only a few percent of them are released, they will lead to a jump in the average temperature of the Earth's atmosphere by 10°C and produce a "Permian" style major extinction event which will kill us all (Light 2012, 2103; Wignall, 2009). The whole northern hemisphere is now covered by a thickening atmospheric methane veil that is spreading southwards at about 1 km a day and it already totally envelopes the United States. A giant hole in the equatorial ozone layer has also been discovered in the west Pacific, which acts like an elevator transferring methane from lower altitudes to the stratosphere, where it already forms a dense equatorial global warming stratospheric band that is spreading into the Polar regions (Data from Harold Hensel, pers. comm. 2014). The spreading atmospheric methane global warming veil is raising the temperature of the lower atmosphere many times faster than carbon dioxide does, causing the extreme summer temperatures in Australia and the United States.
During the last winter, the high Arctic winter temperatures and pressures displaced the normal freezing Arctic air south into Canada and the United States, producing never before seen, freezing winter storms and massive power failures. When the Arctic ice cap finally melts towards the end of next year or the beginning of the next, the Arctic sea will be aggressively heated by the sun and the Gulf Stream. The cold Arctic air will then be confined to the Greenland Ice cap and the hot Arctic air with its high methane content will flow south to the United States to further heat up the Gulf Stream, setting up an anticlockwise circulation around Greenland. Under these circumstances Great Britain and Europe must expect even more catastrophic storm systems, hurricane force winds and massive flooding after the end of next year, due to a further acceleration in the energy transport of the Gulf Stream. If this process continues unchecked the mean temperature of the atmosphere will rise a further 8 degrees centigrade and we will be facing global deglaciation, a more than 200 feet rise in sea level rise and a major terminal extinction event by the 2050s.
Conclusions
The excessive summer global warming of the Gulf Stream off the east coast of North America, is a direct result of the effects of eastward migrating pollution clouds pouring off the coast of the United States and Canada. This heat is transferred by the Gulf Stream directly to the most extreme methane eruption center (The Enrico Anomaly) in the Arctic at the methane hydrate rich, subsea end of the Eurasian Basin/Laptev Sea in October - November during a "False Indian Summer". Here the exponetially increasing rate of methane release into the atmosphere and stratosphere, generates a sequence of events that returns more heat back via the Methane Global Warming Veil to the source zone on the North American Continent. The arrival of the stratospheric Methane Global Warming Veil over North America has caused massive heating and drying, mammoth dust storms, extensive droughts, uncontrollable wild fires and extreme hurricane and tornado events and further global warming of the Gulf Stream in the following summer to fall.
We can look upon the globally heated Gulf Stream, as the North American greenhouse gas pollution hot line to climatic hell. The US and Canada must cut their global emissions of carbon dioxide by 80% to 90% in the next 10 to 15 years, otherwise they will be become an instrument of mass destruction of the Earth and its entire human population. To avoid this terminal calamity, all continent-wide gas fracking, coal and tar sand mining and oil drilling in North America must be immediately stopped.
Recovery of the United States economy from the financial crisis has been very unsoundly based by the present administration on an extremely hazardous "all-of-the-above" energy policy that has allowed continent-wide gas fracking, coal and oil sand mining and the return of widespread drilling to the Gulf Coast. This large amount of fossil fuel has to be transported and sold which has caused extensive spills, explosions and confrontations with US citizens over fracking and the Keystone XL pipeline. Gas fracking is in the process of destroying the entire aquifer systems of the United States and causing widespread earthquakes and sinkholes. The oil spills are doing the same to the surface river run off.
North America must undertake an immediate extreme reduction in carbon dioxide output by 80% to 90% by converting all their gas, oil and coal based electrical power stations to wind and solar power and other renewable energy sources in 10 to 15 years. All ground transport systems must be converted to electrical power energy sources and air and rocket transport to run on Arctic methane. If no action is taken within the next two to three years, the climatic pain will continue to get more and more severe and the recovery cost become astronomical. Russia already has onshore methane hydrate gas fields and developed natural or hydrogen gas powered Tupolev aircraft (Tupolev.ru, 2013) ) while NASA has developed methane rocket engines (NASA, 2007). The potential emission of toxic agents when using liquid natural gas are reduced in the following way. Carbon monoxide 1-10 times, Hydrocarbons 2.5-3 times, Nitrogen oxides 1.5-2 times, Polycyclic aromatic hydrocarbons including benzapyrene 10 times (Tupolev, 2013).
The United States must immediately declare an international emergency of the most extreme kind and call for a UN conference of world governments, gas and oil companies, banks, engineers and scientists to select the fastest and most efficient way to deal with the escalating Arctic methane eruption threat. We are already 3 and a half years passed August 2010 when massive subsea atmospheric emissions started in earnest in the Arctic. The next two and a half years are all we have left to try to put a break on the Arctic methane emissions before the heating effects and sea level rise caused by the loss of floating Arctic and global deglaciation and Arctic methane induced global warming will be completely unstoppable and humanity will be facing total extinction before the middle of this Century (2040-2050).
Although the US Republican party is totally dominated by fossil fuel extraction corporations, it was the failure of previous and existing Democratic party Presidents to make the vital landmark decisions necessary to lead the world's society into a sustainable energy future. President Clinton refused to sign the original Kyoto Protocols, preferring short-term US economic recovery via the dirty fossil fuel route which has led us up to the present extreme climatic crisis tipping point. President Obama with his "all-of-the-above" energy policy is again out to achieve a short-term US economic recovery from the recent Wall Street crisis using dirty fossil fuels. The President has allowed continent-wide gas fracking, coal and tar sand mining and the return of drilling to the Gulf Coast. This has been further exacerbated by major transport of Canadian tar sand oil across the US and an inept foreign policy, where the US and Canada are attempting to take over the European market for their filthy fracked gas and tar sand oil by destroying Russia's credibility as an energy supplier.
A recent EPA initiative by the President to reduce US coal power station pollution by 30% by 2030 is totally insufficient and will not reduce the liability of the President as the greatest promoter of the absolute destruction of the United States environment and aquifer systems by continent wide filthy gas fracking, oil drilling and tar sand mining and the transport of Canadian bitumens by pipeline, road and rail. The Presidents EPA decision was clearly politically motivated as a whitewash for the coming elections. A great leader would have stopped all Federal tax subsidies and incentives paid to oil and gas companies and used this money to assist every one of the 600 U.S. coal power stations to gradually change to solar power including training for the staff and coal miners, so they can work effectively with the new renewable energy.
The Obama Administration and the Harper Government continue with “Business as Usual” while catastrophic global warming is being caused by unabated US and Canadian greenhouse gas emissions. These emissions have speeded up the Gulf Stream three times since the 1940's, transferred increasing volumes of heat to the subsea Arctic, which is now boiling off exponentially increasing amounts of methane from massive subsea methane hydrate reserves. This will cause an Arctic methane firestorm by 2040 to 2050, with total deglaciation and extinction of all life on Earth (Light 2012, 2013, 2014; Carana 2013, 2014). The President has in effect signed humanity's death warrant for a meeting with a fast approaching Arctic methane firestorm in 2040-2050. The only way out of this is for the US electorate to replace the entire US Congress, Senate and President with environmentally friendly and active groups who will react with the extreme speed that is necessary, to prevent our collision with eternity in 2040 - 2050. If either of the major parties remains in power in the US after the following elections, our fate is sealed.
We are now facing a devastating final show down with Mother Nature, which is being massively accelerated by the filthy extraction of fossil fuels by US and Canada by gas fracking, coal and tar sand mining and continent wide bitumen transport. The United States and other developed nations made a fatal mistake by refusing to sign the original Kyoto protocols. The United States and Canada must now cease all their fossil fuel extraction and go entirely onto renewable energy in the next 10 to 15 years, reducing their carbon dioxide emissions by 80% to 90% otherwise they will be guilty of planetary ecocide - genocide by the 2040 - 2050's. There must also be a world-wide effort to capture methane in the Arctic seabed and oceans and eradicate the quantities accumulating in the atmosphere.
What mankind has also done in his infinite stupidity with his extreme hydrocarbon addiction and fossil fuel induced global warming, has opened a giant, long standing (Permian to Recent) geopressured mantle - methane pressure - release safety valve (Enrico Pv Anomaly Extreme Methane Emission Zone) for gases generated in the asthenosphere (Earth's mantle) between 100 km and 300 km depth and temperatures above 1200°C (Light, 2014). There is now no fast way to reseal this system, because it will require extremely quick cooling of the Arctic Ocean, which cannot be achieved in the short time frame we have left to complete the job. Our only hope is to extract methane directly from reservoirs in the subsea Arctic methane hydrates (both methane hydrate and mantle methane), destroy the methane in the water before it gets into the atmosphere and simultaneously destroy the existing atmospheric methane using radio - laser systems (Alamo and Lucy Projects, Light and Carana, 2012, 2013).
Methane-Eating Symbiotic Bacteria which need a Tungsten Catalyst
Scientists at Georgia Tech University have found that at very low temperatures in the ocean, two symbiotic methane eating organisms group together, consume methane and excrete carbon dioxide which then reacts with minerals in the water to form carbonate mounds (Glass et al. 2013). These two symbiotic creatures, the bacteria and anaerobic methanotrophic archaea form bundles and require an enzyme (formyl methofuran dyhydrogenase) in the final methane oxidation reactions to convert methane to carbon dioxide. These organisms also need tungsten for this process to operate (Glass et al. 2013). In the low temperature environments of the methane seeps, tungsten appears easier for the organisms to use than molybdenum (Glass et al. 2013).
A method must be immediately developed for growing these methane consuming organisms in great quantities and delivering them with their vital tungsten operating enzyme to the Arctic Ocean. The Arctic Ocean, west of Svalbard in the area south of the ice-front, where the West Spitbergen Current dives beneath the ice should be continuously seeded with these methane consuming bacteria and tungsten enzymes (possibly by aircraft or boats), as should the Yermack Current in the Barents Sea. The entire length of the Eurasian Basin, The Enrico Pv anomaly extreme emission zone and Laptev Sea should also be seeded during the summer season when the ice cap has receeded from these regions.
As the Arctic ice cap shrinks, the size of the area that needs to be seeded will grow requiring greater resources from the worlds nations. This has to be done, for our very future existence depends on it. Similar seeding should be carried out over currents flowing beneath the Antarctic ice cap to prevent the release of large quantities of methane into the atmosphere from the destabilization of methane hydrates there. This means that the United States must fund a major project at Georgia Tech to quickly develop the means to grow these methane consuming bacteria in massive quantities with their tungsten enzyme and find the means to deliver them to the Polar oceans as soon as possible.
Lucy/Alamo Projects - Hydroxyl Generation and Atmospheric Methane Destruction
 The Lucy Project is a radio beat-frequency/laser system for destroying the first hydrogen bond in atmospheric methane when it forms dangerously thick global warming clouds over the Arctic (Figure 32, Light and Carana, 2012). It generates similar gas products to those normally produced by the natural destruction of methane in the atmosphere over some 15 to 20 years (Figure 32). This system will use similar frequencies to those used in generating nano-diamonds from methane gas in commercial applications over the entire pressure range of the atmosphere from the surface to 50 km altitude (Figure 32, Light and Carana, 2012).
 Methane produced at the surface diffuses upward and is broken down by photo dissociation (sunlight) and chemical attack by nascent oxygen and hydroxyl as below (Heicklen, 1967).
Photo Dissociation
CH4 + Sun’s Radiation = CH3 + H
Chemical Attack
O + CH4 = HO + CH3
O + HO + CH3 = CH2O + H2O
HO + CH4 = CH3 + H2O
A modified version of the Lucy Project to generate hydroxyls at the sea surface using beams of polarized 13.56 MHZ radio beams is illustrated in Figure 32. In this system three additional transmitters on three separate ships will have their antenna placed slightly lower than the main 13.56 MHZ methane destruction antennae. Recent experiments have shown that when a test tube of seawater was illuminated by a polarized 13.56 MHZ radio beam, that flammable gases (nascent hydrogen and hydroxyls) were released at the top of the tube (iopscience.iop.org, 2013).
In the modified version of the Lucy Project, hydroxyls will be generated by a polarized 13.56 MHZ beam intersecting the sea surface over the region where a massive methane torch (plume) is entering the atmosphere so that the additional hydroxyl produced will react with the rising methane, breaking a large part of it down. In the Arctic Ocean, the polarized 13.56 MHZ radio waves will decompose atmospheric humidity, mist, fog, ocean spray and the surface of the waves themselves into nascent hydrogen and hydroxyl (iopscience.iop.org, 2013).
A better system could use Nd:glass heating lasers containing hexagonal neodymium which is stable below 863°C (Krupke 1986 in Lide and Frederickse, 1995). Neodymium glass lasers have extreme output parameters with peak powers near 10 to the power 14 watts when collimated and peak power densities of 10 to the power 18 watts per square cm if focused (Krupke 1986 in Lide and Frederickse, 1995). Velard (2006) states that at the Lawrence Livermore Laboratory, for inertial confinement nuclear fusion, "192 beams of Nd:glass-plate amplifier chains are being used in parallel clusters to generate very high energy (10 kilojoules) at a very high power here (>10 power 12 watts) and at the second and third harmonics of the fundamental, with flexible pulse shapes and with sophisticated spectral and spacial on-target laser light qualities". The Nd:glass laser system is more stable and efficient than the longer wavelength CO2 lasers and shorter wavelength KrF lasers (Velard, 2006).

The three 13.56 MHz radio transmitters in the Lucy Project could be replaced by 3 groups of parallel lasers each forming a giant circular flash lamp. Each Nd:glass laser in the flash lamp could be tuned to one frequency (M = 2.8476*10 power 8 MHz = 1052.78992 nm) which is exactly 21 million times the 13.56 MHZ methane destruction/nano - diamond formation frequency (Table 7)(Mitura, 1976). The adjacent alternate laser of to a slightly different fequency (N = 2.8475998644*10 power 8 MHz = 1052.78997 nm) will then be exactly out of phase with the primary frequency of (M =2.8476*10 power 8 MHz = 1052.78992 nm) by 13.56 MHz (Table 7). The Nd:glass lasers have a wavlength of 1052 nm equivalent to a frequency of 2.85*10 power 8 MHz. When two frequences M and N are almost the same, they will generate a beat frequency equal to (M - N) which in this case is equal to 13.56 MHz (Table 7)(Illingworth and Cullerne, 2000). This 13.56 MHz beat in the Nd:glass laser heating light beams will occur in the region where they beams overlap with one another in the methane cloud, and will produce an additional force tending to break down the methane molecules, because the 13.56 beat amplitude varies between twice that of the fundamental frequency (M) to zero (Illingworth and Cullerne, 2000).
The methane molecule requires 435 kilo-Joules per mole to dislodge the first hydrogen proton according to the reaction below and an average of 409.3 kJ per mole for the other three protons (Hutchinson, 2014).
CH4 = CH3 + H
Hydroxyl requires 493 kilo-Joules per mole for it to be generated from water as indicated below (Hutchinson, 2014)
H20 = H + OH
Other methane is then broken down by the chemical attack of the hydroxyl (Heicklen, 1967).
Nascent oxygen requires 498.3 kilo-Joules per mole for it to be generated from the stable O2 molecule as shown below (Hutchinson, 2014).
O2 = O + O
Other methane is then broken down by the chemical attack of the nascent oxygen which produces further active hydroxyl that destroys even more methane (Heicklen, 1967).
Because the energy of one of the Nd:glass laser beams is around 1.177 ev, when two alternate Nd:glass lasers are focused in the same region they will have an energy of 2.3553 electron volts (around 227.2563 kilo-Joules per mole). A set of four focused Nd: glass lasers will have an energy of about 454.5 kilo-Joules per mole, and will be strong enough to dislodge the first hydrogen proton from a methane molecule (Table 7). There will also be the additional energy effect caused by the 13.56 MHz beat, the amplitude of which varies from twice the amplitude of the fundamental (M) to zero. The mean energy (for a sign wave) at the beat amplitude peak is 1.414 times higher than the fundamental, ie close to 642.6 kilo-Joules per mole. The 13.56 MHz beat frequency on four focused Nd glass lasers should therefore produce more than enough energy to destroy methane and also generate hydroxyl and nascent oxygen. Of course this can also be achieved by increasing the number of focused lasers to six or eight. Exactly the same neodymium laser system could be shone on the sea surface, at the base of the rising methane cloud, generating hydroxyls and nascent oxygen and thus breaking down the methane.
The French/German Lidar atmospheric methane detecting satellite will give early warning of the build - up of methane in the stratospheric and tropospheric global warming veil. A methane detecting Lidar system should also be immediately installed on the International Space Station to detect methane in the atmosphere and act as a back up and additional calibration for the Merlin satellite.
We have only 10 to 15 years to get an efficient methane destruction radio - laser system designed, tested and installed (Lucy and Alamo (HAARP) Projects) before the accelerating methane eruptions take us into uncontrollable runaway global warming. This will give a leeway of 5 years before the critical 2°C temperature anomaly will have been exceeded and we will be looking at catastrophic storm systems, a fast rate of sea level rise and coastal zone flooding with its disastrous effects on world populations and global stability.
Angels Project
 The Angels (Arctic Natural Gas Extraction, Liquefaction, Sale/Storage) project (Light, 2012; Light and Carana, 2012) are solutions to the extreme Arctic methane build-up that must be done in conjuction with a complete cut-back in carbon dioxide emissions from North America, if we have any hope of stopping this now, almost out of control, exponentially escalating build-up of methane in the atmosphere and its extreme enhancement of global warming.
 The Angels project will require the drilling of inclined boreholes into the subsea Arctic permafrost/methane hydrates to drain the overpressured methane from beneath them and thus depressurize the reservoirs (Figure 33) (Light, 2012). This will stop many of the Arctic sea surface methane eruptions by drawing ocean water down the eruption zones and will allow a controlled destabilization of the undersea methane hydrates producing a natural gas source for many hundreds of years (Figure 33) (Light 2012). This gas can be liquified in surface plants, put into lNG tankers and sold as a feedstock for hydrogen plants or permanently stored in propane-ethane hydrates with carbon dioxide at ambient temperatures in deep ocean basins (Figure 33) (Carana, 2013).
Epilogue
My greatest admiration is for Mother Earth who has carefully held the atmospheric temperature within the stable range necessary for oceans to exist for at least 4 billion years and nurtured the earliest bacteria to evolve into today's space faring humans. To do this Mother Earth has many fail - safe mechanisms and correction factors that are activated if one of the systems goes off line. Such is the ocean/atmosphere cooling system for the giant plate magma-convection-turnover in the Earth's mantle. Mankind's greed and excessive consumption of the earth's natural resources has destroyed this stable state and the Earth will correct by eliminating humanity from the global warming equation, unless we change our ways by going immediately to renewable energy and clear the carbon dioxide and methane from the catastrophically warming atmosphere.
The driving force for the Earth's magma convection system is deep seated radioactivity within the Earth. From Mother Earth's point of view, all surface organic matter would be much more effectively placed in the world, at depths below 150 km in the globe encircling subduction zones. Here in the form of diamonds, the organic carbon would sharpen and speed up the rate of descent of the heavy subducting plates to counteract the failure of the ability of the atmosphere and oceans (caused by global warming) to conduct and convect the surface magmatic heat fast enough away into outer space, from the hot erupting magmatic ridges, volcanic arcs and cooling and sinking oceanic plates. Humanity's absolute incompetence and stupidity caused by our fatal addiction to fossil fuels in assessing and dealing with the impact of global warming and climate change can only lead to our total extinction in the near future. When it is all over by 2050, Aliens are sure to arrive and pick their way through the debris of our flooded cities when they come to terraform the Earth to their own liking.