Mantle Methane Leakage via Late Permian Deep Penetrating Fault and Shear Fracture Systems Rejuvenated by Carbon Dioxide and Methane Induced Global Warming
By Malcolm P.R. Light, Harold H. Hensel and Sam Carana
Abstract
In North Siberia some 30 permafrost methane eruption vents occur along the trend of the inner (continental side) third of the Late Permian Taimyr Volcanic Arc where the crust and mantle were the weakest and the most fractured. Deep penetrating faults and shear systems allowed molten basaltic magmas charged with large volumes of carbon dioxide and methane free access to the surface where they formed giant pyroclastic eruptions. The large volume of carbon dioxide and methane added to the atmosphere by this Late Permian volcanic activity led to a massive atmospheric temperature pulse that caused a major worldwide extinction event (Wignall, 2009). These deep penetrating fractures form a major migration conduit system for the presently erupting methane vents in the North Siberian permafrost and the submarine Enrico PV Anomaly. During periods of lower atmospheric carbon dioxide and lower temperatures, the permafrost methane vents became sealed by the formation of methane hydrate (clathrate) plugs forming pingos. The surface methane clathrate plugs are now being destabilized by human pollution induced global warming and the mantle methane released into the atmosphere at the permafrost methane explosion vents. This has opened a giant, long standing (Permian to Recent) geopressured, mantle methane pressure-release safety valve. There is now no fast way to reseal this system because it will require extremely quick cooling of the atmosphere and the Arctic Ocean. The situation calls for comprehensive and effective action, including breaking down the methane in the water before it gets into the atmosphere using methane devouring symbiotic bacteria (Glass et al. 2013) and simultaneously breaking down the existing atmospheric methane using radio-laser systems which can also form methane consuming hydroxyl molecules (Alamo and Lucy Projects, Light and Carana, 2012, 2013).

During 2014 and 2015 at least 30 methane eruption vents, 7 of which are very large were identified in northern Siberia in the permafrost (Figures 1 to 3)(Zulinova in Liesowska 2015, Wales, 2015, Wignall 2009, Light 2014, Scribbler R., 2015). Of the seven major methane eruption vents (craters) in the Arctic area, 5 are on the Yamal Peninsula, one is in the Yamal Autonomous District and the seventh near Krasnoyarsk close to the Taimyr Peninsula (Figure 3, Liesowska, 2015). This permafrost methane eruption vent zone correlates with the inner third of the continental side of the Late Permian Age Taimyr Volcanic Arc where the top of the underlying Permian subduction zone lay at a depth between 200 km and 225 km (Figure 3, Light 2014). These methane eruption vents occur along fracture systems, transform faults, strike slip-slip faults oblique to the subduction direction and normal fault lines that also cut the Permian volcanic arc and the permafrost up to the continental edge of the arc (Figure 3).

In the Late Permian a massive eruption phase occured along the entire central and north eastern part of the "Taimyr Volcanic Arc" producing an extremely wide and thick sheet-like succession of flood trap lavas and tuffs (Siberian Traps Large Igneous Province) that spread south eastwards over the Siberian Craton (Figure 2, Light 2014). During the Late Permian there was a major global extinction event which resulted in a large loss of species caused by catastrophic methane eruptions from destabilization of subsea methane hydrates in the Paleo-Arctic (Figures 2, 3 and 4)(Wignall 2009, Light 2014, Scribbler 2015, Merali 2004, Goho 2004, Scott et al, PNAS, Dawson 1967, Kennedy and Kennedy, 1976). Extreme global warming was caused when vast volumes of carbon dioxide were released into the atmosphere from the widespread eruption of volcanics in northern Siberia (Figure 2; Wignall 2009) whose main source zone, the "Taimyr Volcanic Arc" on land in northern Siberia (Figure 3) is not a great distance from the present trend of the Arctic Ocean Gakkel Ridge and the Enrico Pv Anomaly extreme methane emission zone. Because the Arctic forms a graveyard for subducted plates, the mantle there is highly fractured and it is also a primary source zone for mantle methane formed from the reduction of oceanic carbonates by water in the presence of iron (II) oxides buried to depths of 100 km to 300 km in the Asthenosphere and at temperatures above 1200°C (Figure 4)(Gaina et al. 2013; Goho 2004; Merali 2004; Light 2014).

In addition to the widespread eruption of volcanics in Northern Siberia in the Late Permian (250 million years ago), swarms of pyroclastic kimberlites also erupted between 245 and 228 million years ago along a NNE trending shear system in the mantle which extends up the east flank of the Lena River delta and intersects the Gakkel Ridge slow spreading ridge on the East Siberian Arctic Shelf (Figure 4). Cenozoic volcanics also occur to the north and north east of the Lena River delta marking the trend of the slow spreading Gakkel Ridge on the East Siberian Arctic Shelf (Sekretov 1998). All this pyroclastic activity along the slow spreading Gakkel Ridge from the Late Permian to the present is evidence of deep pervasive vertical mantle fracturing and shearing which has formed conduits for the release of carbon dioxide and deeply sourced mantle methane out of Siberia and the Arctic sea floor into the atmosphere (Light 2014).
Thermodynamic Conditions Necessary to form Mantle Methane
On a vertical temperature - pressure/ depth cross section (Figure 4) the surface methane eruption vents are fed from vertical crustal and mantle fractures from more deeply sourced mantle methane below 225 km depth that has migrated up the fractured and sheared surface of the Late Permian subducting oceanic plate and then entered the vertical fractures allowing it to the surface where the methane is now erupting along the inner (continental side) third of the "Taimyr Volcanic Arc" (Dawson, 1967, Kennedy and Kennedy 1976. Merali 2004, Goho 2004, Scott et al, PNAS, Light 2014). What is remarkable is that the present surface methane eruption vent region corresponds exactly to the zone where the crust and mantle was the weakest in the Late Permian because the continental rock melt line (dry solidus) rises steeply to within a few km of the surface peaking exactly in the centre of zone defined by the methane eruption vents (Figure 4).
This implies that in the Late Permian, the inner continental side of the volcanic arc was a region of intense pyroclastic volcanic activity because the lavas were highly charged in carbon dioxide and methane. The eruption of these gases led to massive peak in global warming that culminated in the Major Late Permian Extinction Event when mean global atmospheric temperatures exceeded 26.6°C (Wignall. 2009).

This inner (continental side) third of the "Taimyr Volcanic Arc" was thus severly fractured by extreme pyroclastic volcanic activity and gas effusions in the Late Permian and has remained so up to the present day thus forming a major migration conduit system for the presently erupting methane vents in the Siberian permafrost. During periods of lower atmospheric carbon dioxide and lower temperatures the permafrost methane vents became sealed by the formation of methane hydrate (clathrate) plugs forming pingos (Figures 5, 6 and 7; Hovland et al. 2006; Paull et al., 2007; Carana, 2011, Liesowska, 2015). The surface methane clathrate plugs have now been destabilized by human pollution induced global warming and the methane is being released into the atmosphere at the permafrost methane explosion vents. Extreme methane concentrations, up to 1000 times above the mean atmospheric level has been found at the base of the methane eruption vents by Russian scientists (Holthaus, 2015) confirming that they are still linked to deeper methane sources which may be geopressujred. Before the Yamal B1 methane eruption vent developed, hillocks (pingoes) rose in the permafrost heralding the coming massive methane gas eruption (Figure 7; Liesowska, 2015). Other pingoes adjacent to the Yamal B1 methane eruption vent could also collapse at any moment emitting a large cloud of methane gas (Liesowska, 2015).

In the Last Ice age, the methane seal system (methane hydrate pingos) was maintained by the low temperatures and trapped the mantle methane below the ground. Now however human pollution which caused a massive carbon dioxide atmospheric buildup exceeding 400 ppm has started to break the seals on the mantle methane fractures in 2014 and 2015 allowing them to spew increasingly large quantities of deep mantle methane directly into the Arctic atmosphere. In the Late Permian, the massive volume of carbon dioxide released into the atmosphere during these cataclysmic eruptions produced extreme global warming in the air and oceans which also dissasocciated the Paleo-Arctic permafrost and subsea methane hydrates and the methane hydrate seals above the Enrico Pv Anomaly generating a massive seafloor and mantle methane pulse into the atmosphere that caused the Major Late Permian Extinction Event (Figures 2 to 4) (Wignall. 2009).

A sequence of extreme pyroclastic basaltic eruptions occur along the Gakkel Ridge (85oE volcanoes) which has an ultra - slow rate of plate spreading of 15 to 20 mm a year (Sohn et al. 2007). These volcanoes formed from the explosive eruption of gas - rich basaltic magmatic foams as shown by recovered green - glass fragments and pillow lavas. Long intervals between eruptions during slow spreading produced a huge gas and volatile buildup at high storage pressures deep down in the crust (Sohn et al 2007). A volatile and carbon dioxide content of some 13.5% to 14% (Wt./Wt. - volume fraction 75%) is necessary at 5 km depth in the Arctic Ocean to fragment the erupting magma (Sohn et al. 2007). These extreme pyroclastic basaltic volcanic eruptions are probably a modern day equivalent of the types of eruptions that occured in the region of methane eruption vents along the "Taimyr Volcanic Arc" in the Late Permian and totally fractured the mantle and crust producing deep reaching conduits that allowed mantle methane below 225 km access to the surface (Figure 4). The more fluid Gakkel Ridge pillow lava basalts mirror the very fluid Siberian "Trapp" flows that covered a large part of Siberia in the Late Permian (Figure 2 and 3).
Conclusions
Our present extreme fossil fuel driven, carbon dioxide global warming is predicted to produce exactly the same mantle methane release from the permafrost methane eruption vents along the Late Permian "TaimyrVolcanic Arc", subsea Arctic methane hydrates and the Enrico Pv Anomaly "Extreme Methane Emission Zone" by the 2050's, leading to total deglaciation and the extinction of all life on Earth.
Mankind has, in his infinite stupidity, with his extreme hydrocarbon addiction and fossil fuel induced global warming, opened a giant, long standing (Permian to Recent), geopressured, mantle methane pressure-release safety valve for methane gas generated between 100 km and 300 km depth and at temperatures of above 1200°C in the asthenosphere (Figures 1 to 6). This is now a region of massive methane emissions (Carana, 2011-2015).
There seems to be no fast and easy way to reseal this system. To sufficiently cool the Atmosphere and Arctic Ocean cannot be achieved in the short time frame we have left to complete the job. In some cases, it may be possible to reseal conduits with concrete or other material, or to capture methane for storage in hydrates at safer locations, but the sheer number of vulnerable locations and the size of the work involved is daunting.
Other ways to deal with the methane are to break it down in the water and in the atmosphere, as also depicted in Figure 9 (enhanced decomposition). Efforts to break down methane in the atmosphere using radio-laser systems have been described by Light and Carana (Figure 8, Alamo and Lucy Projects, Light and Carana, 2012, 2013, Ehret 2012; Sternowski 2012; Iopscience, 2013, Arctic-news, 2012). Scientists at Georgia Tech. University have found in the ocean that at very low temperatures two symbiotic methane eating organisms group together, consume methane in the presence of tungsten and excrete carbon dioxide which then reacts with minerals in the water to form carbonate mounds (Glass et al. 2013). This means that the United States must fund a major project at Georgia Tech. to quickly develop the means to grow these methane consuming bacteria in massive quantities with their tungsten enzyme and find the means to deliver them to the Polar oceans as soon as possible. More generally, the situation calls for comprehensive and effective action, as discussed at the
Climate Plan blog.
References
Aagaard K., Foldvik A., Hillman S.R., 1987. The West Spitsbergen Current: Disposition and Water Mass Transformation. Journal of Geophysical Research 92:3778 ACS 2013. Thermal Energy in the Ocean. ACS Climate Science toolkit/Oceans, Ice and Rocks.
http://www.acs.org/content/acs/en/climatescience/oceanicerocks/thermalenergy.html
Allen P.A., and Allen J.R. 1990. Basin Analysis, Principles and Applications. Blackwell Scientific Publications, Oxford. 451 pp.
Anderson D.L., 1989. Theory of the Earth. Blackwell Scientific Publications. Boston 1-366 pp.
Anderson D.L., Minster B.J., and Cole D., 1974. The Effect of Oriented Cracks on Seismic Velocities. J. Geophys. Res. 79, 4011 - 4015.
Anderson D.L. and Whitcomb J. 1973. The dilatancy - diffusion model of earthquake prediction. In: Proceedings of the Conference on Tectonic Problems of the San Andreas Fault System.(A.M. Nur. ed.) 417 - 426. Stanford U. Publ. Geol. Sci. 13.
Anitei S. 2007. How is the Ozone layer menaced? The Daily Climate and Softpedia.
http://www.DailyClimate.org
http://news.softpedia.com/news/How-is-the-Ozone-Layer-Menaced-53762.shtml
Arctic Methane Emergency group (AMEG)
http://ameg.me
Baile L. W. and Braille S.W. 2002. Journey to the Centre of the Earth.
http://web.ics.purdu.ed/~braile/edumod/journey/journey.htm
Baker J.A., MacPherson C.G., Menzies M.A., Thirwall M.F., Al-Kadasi M., Mattey D.P., 1999. Resolving Crustal and Mantle Contributions to Continental Flood Volcanics in Yemen. Constraints from Mineral Oxygen Isotope Data. Jour. of Petrology, Vol 41, Issue 12, pp. 1805 - 1820
Balmaseda M.A., Trenberth K.E., Källén E., 2013. Distinctive climate signals in reanalysis of global ocean heat content. Geophysical Research Letters, Vol. 40, Issue 9, 1754 - 1759.
Bourke R.H., Wiegel A.M. and Paquette R.G. 1988. The westward turning branch of the West Spitsbergen Current. Jounal of Geophysical Research 93: 14065 - 14077
Box J. and Decker D. 2012. Greenland Ice Sheet Reflectivity , July 2000 – 2011, 2012 days 1 – 23. NASA MOD1OA1 data processed by Jason Bird and David Decker. Byrd Polar Research Centre.
Boyd T.J. D'asaro E.A., 1994. Cooling the West Spitsbergen Current: Wintertime Observations West of Svalbard. Journal of Geophysical Research 99:22587
Bryden, H.L., 1979. Poleward heat flux and conversion of available potential energy in
Drake Passage. J. Marine Res., 37, 1 - 22.
Bunker A.F. 1976. Computations of Surface Energy Flux and Annual Air-Sea Interaction Cycles of the North Atlantic Ocean. Mon. Wea. Rev. 104, 1122 - 1139.
Bunker A.F. 1988. Surface Energy Fluxes in the South Atlantic Ocean. Mon. Wea. Rev. 116, 809 - 829.
Bunker A.F., and Worthington V., 1976. Energy Exchange Charts of the North Atlantic Ocean. Bull. Amer. Meteor. Soc. 57, 670 - 678.
Cactus 2000; Wavelength. Unit Converters.
http://www.cactus2000.de/uk/unit/massway.shtml
Calder, N. 1984. Timescale - An Atlas of the Fourth Dimension. Chatto and Windus, London, 288 pp.
Carana, S. 2011. Potential for Methane Release.
http://arctic-news.blogspot.com/p/potential-for-methane-release
Carana, S. 2011a. Runaway Warming 2011. Geo-engineering blog.
http://geo-engineering.blogspot.com/2011/09/runaway-warming.html
Carana S., 2011b. Runaway global warming, 2011. Geo-engineering blog.
http://geo-engineering.blogspot.com/2011/04/runaway-global-warming.html
Carana, S. 2012a. Striking increase of methane in the Arctic. In: Arctic News.
http://arctic-news.blogspot.com/2012/05/striking-increase-of-methane-in-arctic.html
Carana S., 2012b. Record levels of greenhouse gases in the Arctic. Arctic News.
http://arctic-news.blogspot.com/2012/05/record-levels-of-greenhouse-gases-in.html
Carana S., 2012c. Greenland is melting at incredible rate. Arctic News.
http://arctic-news.blogspot.com/2012/07/greenland-is-melting-at-incredible-rate.html
Carana S., 2012d. Getting the picture. Arctic News.
http://arctic-news.blogspot.com/2012/08/getting-the-picture.html
Carana, S. 2012e. Oxygenating the Arctic
http://arctic-news.blogspot.com/p/oxygenating-arctic.html
Carana S., 2012f. The accumulating impact of methane releases in the Arctic and how much time there is left to act.
http://arctic-news.blogspot.com/p/how-much-time-is-there-left-to-act.html
Carana S., 2012g. How much time is there left to act? Abrupt release of 1 Gt of methane.
http://arctic-news.blogspot.com/p/how-much-time-is-there-left-to-act.html
Carana S., 2012h. Potential for Methane Release.
http://arctic-news.blogspot.com/p/potential-for-methane-release.html
Carana, S. 2012i. Runaway Warming. In: Arctic News
http://arctic-news.blogspot.com/p/runaway-warming.html
Carana S., 2013a. Quantifying Arctic Methane.
http://arctic-news.blogspot.com/2013/11/quantifying-arctic-methane.html
Carana S., 2013b. Methane - hydrates.
http://methane-hydrates.blogspot.com/2013/04/methane-hydrates.html
Carana S., 2013c. Methane up to 2241 ppb at 742 mb on January 23, 2013. In: Carana S., 2013, Dramatic increase in methane in the Arctic in January 2013.
http://arctic-news.blogspot.com/2013/02/dramatic-increase-in-methane-in-the-arctic-in-january-2013.html
Carana S., 2013d. Global warming, accelerated warming in the Arctic and runaway global warming. - How much will temperatures rise?.
http://arctic-news.blogspot.com/2013/04/how-much-will-temperatures-rise.html
Carana S., 2013e. Methane levels going through the roof.
http://arctic-news.blogspot.com/methane-levels-going-through-the-roof.html
Carana S., 2013f. Dramatic increase in methane in the Arctic in January 2013.
http://arctic-news.blogspot.com/dramatic-increase-in-methane-in-the-arctic-in-january-2013.html
Carana, S. 2013g Climate Action Plan, part of the Climate Plan
http://climateplan.blogspot.com/p/action.html
Carana S., 2014. Massive methane concentrations over the Laptev Sea.
http://arctic-news.blogspot.com/massive-methane-concentrations-over-the-laptev-sea.html
Carana, S. 2015 Methane Levels Early 2015
http://arctic-news.blogspot.com/2015/03/methane-levels-early-2015.html
CDL, 2013. The Oceans, their Physics, Chemistry and General Biology. UC Press E-Books Collection, 1982 - 2004. University of California Press. California Digital Library (CDL).
http://publishing.cdlib.org/ucpressebooks/view?docId=kt167nb66r&chunk.id=d3_5_ch15&toc.id=ch15&toc.depth=1&brand=eschol
Chao, B.F., Yu, Y.H., Li, Y.S., 2008. Impact of Artificial Reservoir Water Impoundment on Global Sea Level. Science, v. 320, p. 212 – 214.
http://www.skepticalscience.com/sea-level-rise.htm
Chapelle F.H.; O'Neill K., Bradley P.M., Methe B.A., Clufo S.A., Knobell L.L. and Lovely D.R. 2002. A hydrogen - based subsurface microbial community dominated by methanogens. Nature 415 (6869): 312 - 315. Bibcode: 2002. Nature 415. 312C.doi: 10.1038/415312a. PMID11797006.
Church J.A., White N.J., Konikow L.F., Domingues C.M., Cogley G., Rignot E., Gregory J.M., van den Broeke M.R., Monagham A.J., Velicogna I., 2011. Revisiting the Earth's sea - level and energy budgets from 1961 to 2008. Geophysical Research Letters. Vol. 40, Issue 15, 4066. Article first published online 8 Aug. 2013.
Church J.A., White N.J., Thorkild A., Wilson W.S., Woodworth, P.L. Domingues C.M., Hunter J.R., Lambeck K., 2008. Understanding global sea levels: past, present and future. Special Feature. Original Article. Sustain Sci. V.3, pp. 9 - 22.
http://academics.eckerd.edu/instructor/hastindw/MS1410_001_FA08/handouts/2008SLRSustain.pdf
Coachman L.K. and Barnes C.A., 1963. The movement of the Atlantic water in the Arctic Ocean. Arctic, 16(1); 9 - 16. Collett, T.S., 1995. Gas Hydrate Resources of the United States. In Gautier D.L. et al. eds. National assessment of United States oil and gas resources on CD-ROM. U.S. Geological Survey Digital Data Series 30.
Columbia, 2013. Subduction zones.
http://www.columbia.edu/~vjdi/subd_zone_basic.htm
Extent of the Siberian Trapps-ru.svg Kaidor - собственная работа based on File:Extent of Siberian traps german.png and File:Russland Relief.png
http://Commons.wikimedia.org (2015).
Connor, S. 2011. Shock as retreat of Arctic sea ice releases deadly greenhouse gas. Russian research team astonished after finding fountains of methane bubbling to surface. The Independent.
http://www.independent.co.uk/environment/climate-change/shock-as-retreat-of-arctic-sea-ice-releases-deadly-greenhouse-gas-6276134.html
Cook J. 2013. 4 Hiroshima bombs worth of heat per second. In: Skeptical Science.
http://www.skepticalscience.com/4-Hiroshima-bombs-worth-of-heat-per-second.html
CPOM, 2014. Cryosat finds sharp increase in Antarctica,s ice losses.
http://www.esa.int/Our-Activities/Observing_the_Earth/Cryosat/
Cryosat_finds_sharp_increase_in_Antarctica_s_ice_losses Csanady G.T., 2001. Air - Sea Interactions. Laws and Mechanisms. Cambridge University Press. 239 pp. DATAWeb, 2011. Combined Data Earth Policy Institute.
http://www.earth-policy.org/datacenter/.../update29_5x
http://www.earth-policy.org/datacenter/.../update20_3x
Dawson J.B. 1967. A review of the geology of kimberlite. In: Ultramafic and Related Rocks (Wyllie P.J., ed). Wiley, New York. 269 - 278
Diamond Stability Zone in the Earth. P-T Diagram.
http://geology.gsapubs.org/content/30/10/947/F3expansion.html
Dessus, B., and Laponche B., Herve le Treut, 2008. Global Warming: The Significance of Methane bd-bl-hlt January 2008.
http://www.global-chance.org/IMG/pdf/CH4march2008.pdf
Dmitrenko I.A., Polyakov I.V., Kirilov S.G., Timokhov L.A., Frolov I.E., Sokolov V.T., Simmons H.L., Ivanov V.V., et al. 2006. Toward a warmer Arctic Ocean: Spreading of the early 21st Atlantic Water warm anomaly along the Eurasian Basin margins. Journal of Geophysical Research 113: C05023
Dziewonski A.M., and Anderson D.L., 1981. Preliminary Reference Earth Model. Phys. Earth Planet. Inter. 25, 297 - 356
Edwards, M. H., Kurras, G. J., Toltsoy, M., Bohnenstiehl, D. R., Coakley, B. J., Cochran, J. R., 2001. Evidence of recent volcanic activity on the ultraslow – spreading Gakkel ridge. Letters to nature. Nature 409. no.6822, 808 – 812.
http://www.volcano.si.edu/world/volcano/cfm?vnum=1707-02-&volpage=var
Ehret G. 2010. Merlin: French – German Climate Satellite to be launched in 2014. Lidar Department, Institute of Atmospheric Physics, Deutches Zentrum für Luft – und Raumfahrt (DLR)
http://www.dlr.ge/pa/en/desktopdefault.aspx/tabid-2342/6725_read-26662/
Engineering Toolbox, 2011. Gases – Specific Gravities.
http://www.engineeringtoolbox.com/specific-gravities-gases-d_334.html
Fahrbach E., Meincke J., Osterhus S., Rohardt G., Schauer U., Tverberg V., Verduin J., 2001. Direct measurements of volume transports through Fram Strait. Polar Research 20(2), 217
Galt J.A. 1967. Current Measurements in the Canadian Basin of the Arctic Ocean, Summer, 1965. Technical Report No.184. Arctic Institute of North America. Office of Naval Research.
https://dlib.lib.washington.edu/dspace/bitstream/handle/1773/16076/M67-15.pdf?sequence=1
Gapminder, 2012. Yearly Human Carbon Dioxide Emissions
http://www.gapminder.org/world
Gaina C., Medvedev S., Torsvik T.H., Koulakov I., Werner S.C., 2013. 4D Arctic: A Glimpse into the Structure and Evolution of the Arctic. In the light of New Geophysical Maps, Plate Tectonics and Tomographic Models. Surv. Geophys. DOI.10.1007/s10712-013-9254-y.
http://earthdynamics.org/papers-ED/2013/2013-Gaina-etal-SurvGeophys.pdf
GEBCO (1979) and IBCAO (2000). Oblique view of the continental shelves of the Eastern Siberian and Laptev Seas.
http://www.ngdc.noaa.gov
Glasby G.P. 2006. Abiogenic origin of hydrocarbons: an historical review. PDF. Reservoir Geol. 56(1) 88 - 96.
Glass J.B. et al. 2013. Geochemical, metagenomic and metaproteomic insights into trace metal utilization by methane - oxidizing microbial consortia in sulfidic marine sediments. Environmental Microbiology 2013.
http://onlinelibrary.wiley.com/doi/10.1111/1162-2920.12314/abstract
Glass J.B. et al. 2013. Geochemical, metagenomic and metaproteomic insights into trace metal utilization by methane - oxidizing microbial consortia in sulfidic marine sediments. Environmental Microbiology 2013. In: Methane-Eating Microbes Need Trace Metal,
http://geo-engineering.blogspot.com/2013/12/methane-eating-microbes-need-trace-metal.html
Goho A., 2004. Deep Squeeze: Experiments Point to Methane in the Earth's Mantle. Science News.
https://www.sciencenews.org/article/deep-squeeze-experiments-point-methane-earths-mantle
Gusev E.A. 2013. The Structure of Gakkel Mid - Ocean Ridge and Laptev Sea Continental Margin Junction.
http://www.evgengusev.narod.ru/gakkel.html
Häkkinen S., and Cavalieri D.J., 1989. A study of oceanic surface heat fluxes in the Greenland, Norwegian and Barents Seas. J. Geophys. Res. 94, 6145 - 6157.
Halbouty M. 2001. Giant Oil and Gas Fields of the Decade (1990 - 1999). An Introduction:
http://www.searchanddiscovery.com/documents/halbouty03/index.htm
Hansen, J. E. 2011. GISS Surface Temperature Analysis. NASA. Goddard Institute for Space Physics.
http://data.giss.nasa.gov/cgibin/gistemp/do_nmap.py?year_last=2011&month_last=08&sat=4&sst=1&type=anoms&mean_gen=02&year1=2009&year2=2009&base1=1951&base2=1980&radius=1200&pol=pol
Hargraves, 2012. Altitudes of World Cities. Hargraves Advanced Fluidic Solutions.
http://www.hargravesfluidics.com
Harrison, J.C., St-Onge, M.R., Petrov, O., Streinikov, S., Lopatin, B., Wilson, F., Tella, S., Paul, D., Lynds, T., Shokalsky, S., Hults, C., Bergman, S., Jepsen, H. F. and Solli, A., 2008. Geological Map of the Arctic, Geological Survey of Canada, Open File 5816, Scale 1:1000,000. 5 Sheets. Arctic Map on Adobe Illustrator:
http://gscof-5816-e-2008-mn01.pdf
Haugan P. M., 1999. Structure and heat content of the West Spitzbergen Current. Polar Research 18 (2), 183
Heiklen, J. 1976. Atmospheric Chemistry. Academic Press, New York, 406 pp.
Hensel H. pers. com. 2014. Methane Ranges, 26th January, 2014. US Geological Survey, Google Earth.
Hensel H., 2014. Methane Rising Through Fractures.
http://arctic-news.blogspot.com/2014/07/methane-rising-through-fractures.html
Hillen, M.H., Jonkman, S.N., Kanning, W., Kok, M., Geldenhuys M., Vrijling J.K. and Stive, M.J.F., 2010. Coastal Defence Cost Estimates Case Study of the Netherlands, New Orleans and Vietnam. The Netherlands, TU Delft. Available from:
http://tiny.cc/wikh
http://repository.tudelft.nl/view/ir/uuid%3A604825d4-f218-40fc-b3b5-5f4280b2338d/
Holthaus E., 2015. Siberia's Permafrost is Exploding. Is Alaska's Next? Future Tense. The Citizens Guide to the Future.
http://www.slate.com/blogs.future_tense/2015/04/02/exploding_methane_holes_in_siberia_linked_to_climate_change April 2, 2015 2:53 pm
Höök M., Bardi U., Feng L., Pank X., 2010. Development of oil formation theories and their importance for peak oil. Marine and Petroleum Geology. Volume 27. Issue 9, October 2010, P. 1995 - 2004.
http://www.sciencedirect.com/science/article/pii/S0264817210001224
http://www.tsi.u.u.se/uhdsg/Publications/Abiotic_article.pdf
Hovland el al. 2006. Submarine pingoes: Indicators of shallow gas hydrates in a pock - mark at Nyegga, Norwegian Sea. Marine Geology, 228, 15 -23.
http://www.sciencedirect.com/science/article/pii/S0025322705003968
Huebner W.F. (Ed) 1990. Physics and Chemistry of Comets. Springer - Verlag. ISBN978-0-387-51228-0
Hutchinson J., 2014. Bond Energies in Polyatomic Molecules. General Chemistry.
http://www.vias.org/geochem/energetics_12592_05.html
Hyperphysics, 2013. Heat of Fusion, Heat of Vaporization.
http://hyperphysics.phy-astr.gsu.ed/hbase/thermo/phase2.html
Illingworth V. and Cullerne, J., 2000. The Penguin Dictionary of Physics, 3rd Edition. Market House Books Ltd. Clays Ltd. St Ives, 492 pp.
Intergovernmental Panel on Climate Change (IPCC) 1992a. Climate Change. The IPCC Scientific Assessment (Edited by J. J. Houghton, G. J. Jenkins and J. J. Ephraums). Cambridge University Press, Cambridge. U.K.
Intergovernmental Panel on Climate Change (IPCC) 1992b. Climate Change in 1992. The Supplementary report to the IPCC Scientific Assessment (Edited by J. J. Houghton, B. A. Callander and S. K. Varney). Cambridge University Press, Cambridge. U.K.
Intergovernmental Panel on Climate Change (IPCC) 2007a. Fourth Assessment Report on Climate Change 2007. FAO 3.1, Figure 1, WG1, Chapter 3, p. 253.
http://blogs.ei.colombia.edu/wp-content/uploads/2010/12/graph-2-600X422.jpg
http://www.ipcc.ch/pdf/assessment-report/ar4/wg1/ar4-wg1-chapter3.pdf
Intergovernmental Panel on Climate Change (IPCC) 2007b. Synthesis Report
http://www.ipcc.ch/publications_and_data/ar4/syr/en/spms1.html
Intergovernmental Panel on Climate Change (IPCC) 2007b. Fourth Assessment report on Climate Change 2007 - temperature rise projections.
http://ipcc.ch/publications_and_data/ar4/wg1/en/spmsspm-projections-of.html
IPCC Fourth Assessment Report on Climate Change 2007 - temperature rise projections
http://ipcc.ch/publications_and_data/ar4/wg1/en/spmsspm-projections-of.html
Ivanov A.V., Demonterova, E.I., Rasskazov S.V., Yasnygina T.A. 2008. Low Ti melts from the South Eastern Siberian Traps - Large Igneous Province: Evidence for a Water - Rich Mantle Source?
J. Earth Syst. Sci. 117, No.1, pp. 1 - 21.
http://link.springer.com/article/10.1007%2Fs12040-008-0008-z
http://www.ias.ac.in/jessci/feb2008/doo47.pdf
Kennet, J.P., Cannariato, K.G., Hendy, I.L., Behl, R.J., 2003. Methane Hydrates in Quaternary Climate Change. The Clathrate Gun Hypothesis, Washington D.C., American Geophysical Union. ISBN 0875902960
Kenney J.K., Kutcherov V., Bendeliani N., and Alekseev V. 2002. The evolution of multicomponent systems at high pressure: VI. The thermodynamic stability of the hydrogen - carbon system. The genesis of hydrocarbons and the origin of petroleum. Proceedings of the National Academy of Sciences of the United States of America 99(17): 10976 - 10981.
Kestin J. et al. 1984. J. Phys. Chem. Ref. Data 13, 229.
Khain V.E., Geology of Northern Eurasia (Ex - USSR), 1994. Second part of the Geology of the USSR. Phanerozoic fold belts and young platform. Gebrüder Born Traeger. Berlin 404 pp.
Kholodov , A.I., Romanovskii N.K., Gavrilov A.V., Tipenko, G.S., Drachev S.S.,
Hubberten H.W., Kassens H., 1999. Modeling of the Offshore Permafrost Thickness on the Laptev Sea Shelf. Polarforschung 69, 221 - 227.
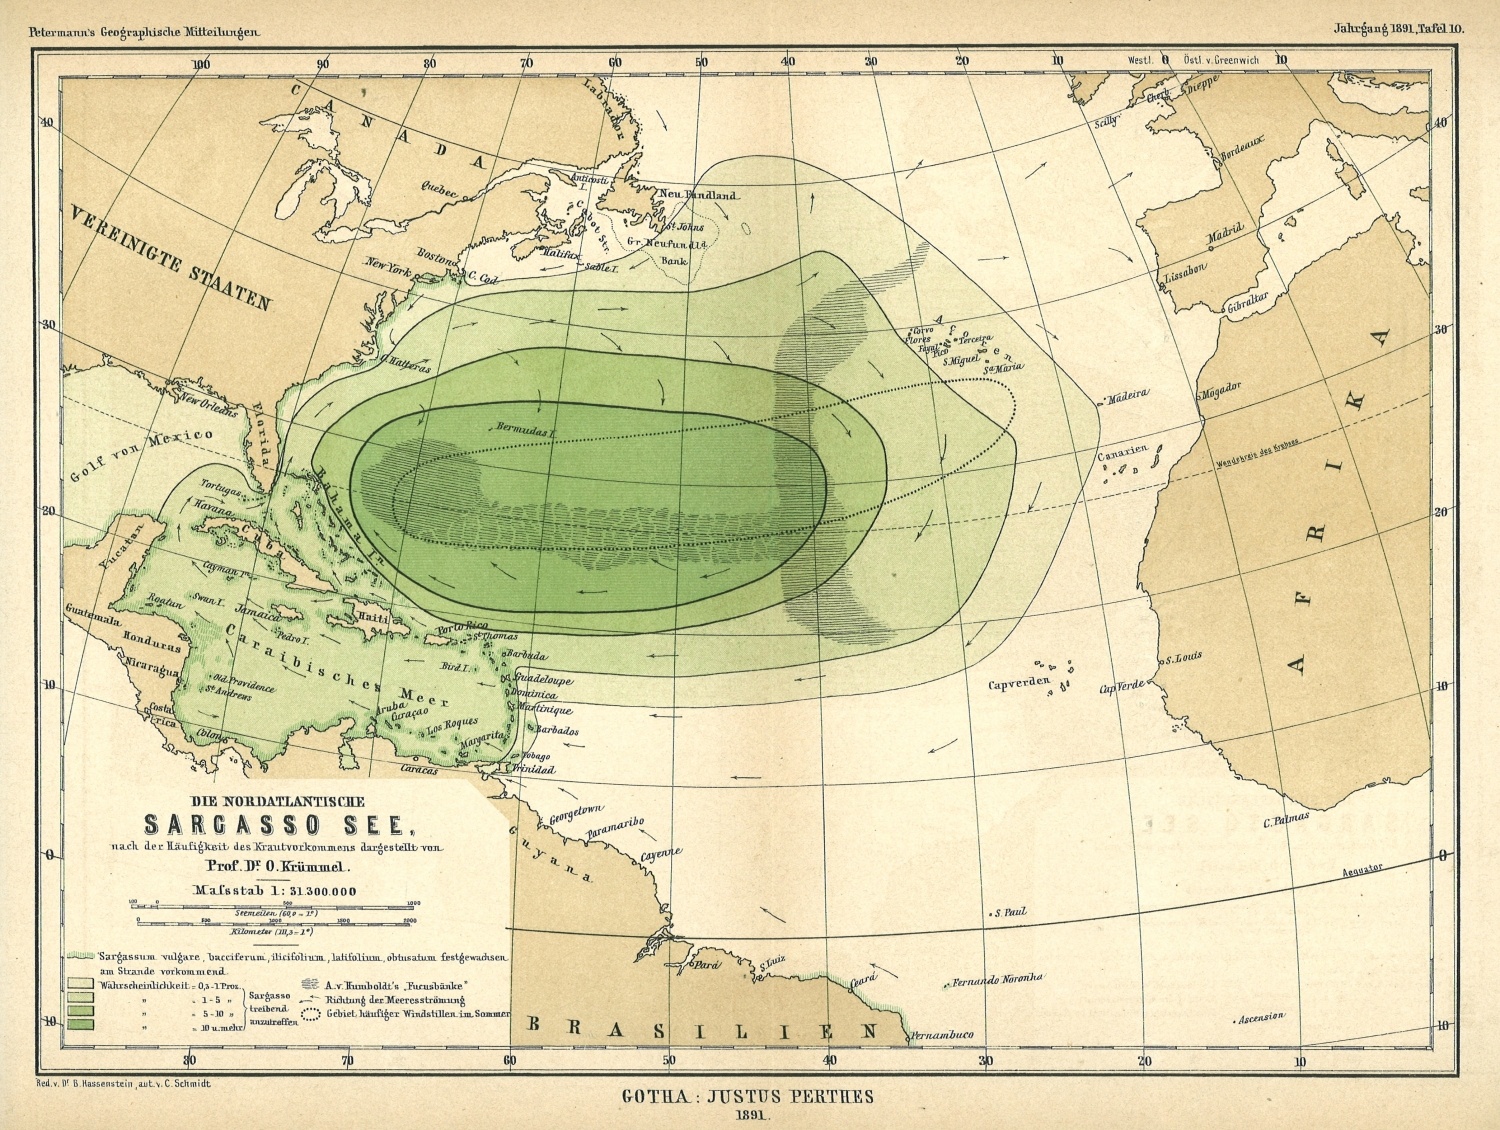
Krümmel D.O., 1891. Die Nordatlantische Sargasso Sea. Map. Scale 1:31300.000. Gotha: Justus Perthes.
http://www.gc.noaa.gov/images/gcil/1891_SargassoSee_Krummel_Petermanns_lores.jpg
Krupke W.W., 1986. Characteristics of Laser Sources. In: Handbook of Laser Science and Technology. Vol 1, Weber, M.J. Ed. CRC Press, Boca Raton, Florida. In:
Lide R., and Frederickse H.P.R., 1995. CRC Handbook of Chemistry and Physics. 75th Edition. 1-1 to 1-33.
Kvenvolden, K.A., 1988. Methane hydrate - a major reservoir of carbon in the shallow geosphere? - Chemical Geology, v. 71, pp. 41 -51.
Kvenvolden, K.A., 1988. Estimates of the methane content of world-wide gas-hydrate deposits - Methane resources in the Next Future? Panel Discussion. INOC-TRC, Japan, p. 1 - 8.
Kvenvolden, K.A., 1988. A primer on the geological occurence of gas hydrate. In: Henriet, J.P., and J Mienert (Eds.) Gas hydrates, relevance to world margin stability and climate change. Geological Society london. Spec. Pubs. 137, 9 - 30.
Kvenvolden, K.A., and Claypool, G.E., 1988. Gas hydrates in the oceanic sediment. In: U.S. Geol.Surv. Open - file Rep. No. 88 - 216, 50 pp.
Kvenvolden, K.A., Frank, T.J., Golan - Bac, M., 1990. Hydrocarbon gases in Tertiary and Quaternary sediments offshore Peru - results and comparisons. In: Proc. ODP: Sci. Results, 112, E. Suess and R. von Huene (Eds.). Ocean Drilling Program, College Station, Tx, pp. 505 - 516.
Kvenvolden, K.A., and Grantz, A., 1990. Gas hydrates of the Arctic Ocean region. In: The Geology of North America 50, The Arctic Ocean region. Geological Sciety of America, pp 539 - 549.
Kvenvolden, K.A. and Kastner, M., 1990. Gas hydrates of the Peruvian outer continental margin. In: Proc. ODP: Sci Results, 112, E. Suess and R. von Huene (Eds.). Ocean Drilling Program, College Station, Tx, pp. 517 - 526.
Kvenvolden, K.A., and Lorenson, T.D., 2001. The global occurence of natural gas hydrate. In: C.K. Paul and W.P. Dillon (Eds.). Natural Gas Hydrates. Occurence, distribution and detection, Geophysical Monograph 124, American Geophysical Union, p. 3 - 18.
Larousse F. and Auge C. 1968. Nouveau Petit Larousse en Couleurs Libraire, Larousse Paris, Georges Lang, Paris, 1662 pp.
Lavatus Prodeo 2012. Living in a 4C World.
http://Lavatusprodeo.net/archives/2010/08/16/living-in-a-4C-world
Lawver L.A., Dalziel I.W.D., Norton I.O., and Gahagan L.M., 2009. The Plates 2009 Atlas of Plate Reconstruction (750 Ma to Present Day). Plates Progress Report No. 325 - 0509. The University of Texas Technical Report. No. 196, p. 52.
http://www.ig.utexas.edu/research/projects/plates/250.htm
Lecture 5, 2014. Subduction Zones and Island Arcs.
http://www.ie.ac.uk/gl/art/g/209/lecture5/lecture5.html
Levitus et al. 2012. Global Ocean Heat Content. NOAA/NESDIS/NODS Ocean Climate Laboratory. Updated from Levitus et al. 2012. Global Oceanic Heat and Salt Content. In: NOAA National Oceanographic Data Center (NODS), United States Department of Commerce.
http://www.nodc.noaa.gov/OCS/3M_HEAT_CONTENT/Index.html
Lide. D.R. and Frederikse H.P.R., 1995. CRC Handbook of Chemistry and Physics. 75th Edition, CRC Press, London. pp. 1-1 - 1-33.
Liesowska, A. 2015. Dozens of new craters suspected in northern Russia. The Siberian Times.
http://siberiantimes.com/science/casestudy/news/n0127-dozens-of-mysterious-new-craters-suspected-in-northern-russia 23 February 2015.
Light M.P.R. 2014. Mantle Methane. High Rate of Spreading of the Arctic Atmospheric Global Warming Veil South of the Gulf Coast is Driven by Deep Seated Methane Release from Giant Mantle Geopressured-Geothermal Reservoirs below the Siberian Craton at Depths of 100 km to 300 km and at Temperatures above 1200 Degrees Celsius.
http://arctic-news.blogspot.com/2014/02/mantle-methane.html
Light M.P.R. 2011b. Global Warming
http://globalwarming.mlight.blogspot.com
Light M.P.R., 2012. Global extinction within one human lifetime as a result of a spreading atmospheric Arctic methane heatwave and surface firestorm. Arctic-News.
http://arctic-news.blogspot.com/p/global-extinction-within-one-human.html
Light M.P.R., 2013. The Non - Disclosed Extreme Arctic Methane Threat. The 2013 Australian above average temperatures set a record of 0.22oC higher than the 12 month period prior to 2013 and confirm a mid - 21st century atmospheric methane - induced global deglaciation and major extinction event.
https://sites.google.com/site/runawayglobalwarming/the-non-disclosed-extreme-arctic-methane-threat
Light M.P.R. 2011a. Use of beamed interfering radio frequency transmissions to decompose Arctic atmospheric methane clouds. Edited by Sam Carana.
http://arctic-news.blogspot.com/p/decomposing-atmospheric-methane.html
Light M.P.R. 2011c. Stratospheric methane global warming veil. Edited by Sam Carana. In: Arctic News.
http://arctic-news.blogspot.com/p/stratospheric-methane-global-warming.html
Light M.P.R., 2012a. Global exctinction within one human lifetime as a result of a spreading atmospheric methane heatwave and surface firestorm. Edited by Sam Carana. In Arctic News.
http://arctic-news.blogspot.com/p/global-extinction-within-one-human.html
Light M.P.R., 2012b. How much time is there left to act, before methane hydrate releases will lead to human extinction? Edited by Sam Carana. In: Geo-Engineering.
http://geo-engineering.blogspot.com/2012/02/how-much-time-is-there-left-to-act.html
Light M.P.R. 2012c. Angels Proposal - A Proposal for the Prevention of Arctic Methane Induced Catastrophic Global Climate Change by Extraction of Methane from beneath the Permafrost/Arctic Methane Hydrates and its Storage and Sale as a Subsidized "Green Gas" Energy Source. LGS. 49 pp. In: Arctic News.
http://arctic-news.blogspot.com/2012/05/proposal-to-extract-store-and-sell.html
Light M.P.R. 2012. Further Confirmation of a Probable Arctic Sea Ice Loss by Late 2015. Edited by Sam Carana. In: Arctic News.
http://arctic-news.blogspot.com/2012/09/further-confirmation-of-a-probable-arctic-sea-ice-loss-by-late-2015-loss.html
Light, M.P.R. et al., 2011b. Methane linked to seismic activity in the Arctic
http://arctic-news.blogspot.com/p/seismic-activity.html
Light M.P.R. and Solana C., 2002a. Arctic methane hydrates - Mapping a potential greenhouse gas hazard. Abstract and Poster, EGS, Nice. - Appendix at:
http://arctic-news.blogspot.com/p/seismic-activity.html
Light, M.P.R. and Solana, C. , 2002b- Arctic Methane Hydrates: A Potential Greenhouse Gas Hazard
http://adsabs.harvard.edu/abs/2002EGSGA..27.4077L
Light, M.P.R., Posey, H.H., Kyle, J.R., and Price P.E., 1987. Model for the origins of geopressured brines, hydrocarbons, caprocks and metallic mineral deposits; Gulf Coast, U.S.A., In: Lerch, Ian and O'Brien, J.J., Dynamical geology of salt and related structures: Orlando, Florida, Academic Press, pp. 787 - 830.
Light M.P.R., 1985. Structure, facies, continuity and internal properties of the Frio "A" sandstone, N.E. Hitchcock Field, Galveston County, Texas. In: Dorfman, M.H., and Morton R.A., eds., Geopressured - Geothermal Energy, Proceedings of the Sixth U.S. Gulf Coast Geopressured - Geothermal Energy Conference Pergamon, p. 229 - 238.
Li Z., Guo Z., Bai Z., Lin G., 2004. Geochemistry and Tectonic Environment and Reservoir Formation of Mantle - Derived Natural Gas in the Songiliao Basin, Northeastern China. Geotectonica et Metallogenia
Liu B., Wang B.S., Ji W.G., Kern H., Popp T., 2001. Closure of Micro - Cracks in Rock Samples under Confining Pressure. Chinese Journal of Geophysics. Vol 44, No. 3, 2001.
http://www.agu.org/WPS/cig/44/44.03/articles/440316.pdf
LIP, 2013. October 2013 LIP of the Month (Large Igneous Provinces).
http://www.largeigneousprovinces.org
Lopatin, N.V. 1971. Temperature and geologic time as factors in coalification (in Russian). Akad. Nauk SSSR. Izvestiya. Seriya Geologicheskaya, 3, pp.95 - 106.
MacDonald G.J., 1988. Major Questions about Deep Continental Structures. In: A. Bodeń K.G., Eriksson. Deep Drilling in Crystalline Bedrock, v.1. Berlin: Springer Verlag. pp. 28 -48. ISBN 3 -540 - 18995 - 5. Proceedings of the Third International Symposium on Observation of the Continental Crust through Drilling held in Mora and Orso, Sweden, September 7 - 10, 1987.
Manley T.O. 1995. Branching of the Atlantic Water within the Greenland-Spitsbergen Passage. An estimate of recirculation. Journal of Geophysical Research 100: 20627
Marreo T.R. and Mason E. A. 1972. J. Phys. Chem. Ref. Data 1, 1.
Masters. J. 2009. Top Climate Story of 2008. Arctic Sea Ice Loss. Dr Jeff Masters Wunderblog.
http://www.wunderground.com/blog/JeffMasters/comment.html?entrynum=1177
Max, M.D., and Lowrie, A., 1993. Natural gas hydrates, Arctic and North Sea potential. In Vorren, T.O., Bergsager, E., Dahl-Stamnes, A., Holter, E., Johansen, B., lie, e., and Lund, T.B.. Arctic Geology and Petroleum Potential, Proceedings of the Norwegian Petroleum society Conference, 15 - 17 august 1990, tromso, Norway, Norwegian Petroleum Society (NPF), Special Publication 2, Elsevier, Amsterdam, 27 -53.
Merk J. 2012. CPSP118G Spring Semester SGC Colloquim. Climate and How it Works I. Physical Components. University of Maryland.
http://www.geol.umd.edu/sgc/lectures/climatepart1.html
Merali Z., 2004. Earth's Mantle can Generate Methane. Nature. doi:10.1038/news040913-5.
http://www.nature.com/news/2004/040913/fullnews040913-5.html
Mineral Commodities Survey - Helium. January 2011, USGS.
http://minerals/pubs/commodity/helium/mcs-2011-heliu.pdf
MIT. 2012. Mission 2011. Saving the Oceans. Climate Change
http://web.mit.edu/12.000/www/M2011/finalwebsite/solutions/climate.shtml
Mitura, S., Mitura, K., Niedzielski, P., Louda R., Danilenko, V., 2006. Nanocrystalline diamond, its synthesis, properties and applications. Journal of Achievements in Materials and Manufacturing Engineering, Vol 16, Issue 1-2, pp 9 -16.
http://journalamme.org/papers_cams05/1244.pdf
Morgan W. J. 1981. Hot Spot tracks and the opening of the Atlantic and Indian oceans. In C. Emiliani (Ed.) The Oceanic Lithosphere. Wiley, New York. pp. 443 - 487.
Morrison 2012. Sea Ice Death Spiral Driving Atlantic Water into Arctic Causing Wild Weather. Get Energy Smart! Now. Blogging for a Sustainable Energy Future.
http://getenergysmartnow.com/2012/01/20/sea-ice-death-spiral-driving-atlantic-water-into-arctic-causing-wild-weather/
Murphy D.M., Solomon S., Portmann R.W., Rosenlof K.H., Forster P.M., Wong T., 2009. An obervationally based energy balance for the Earth since 1950. Journal of Geophysical Research: Atmospheres (1984 - 2012), Vol. 114, Issue D17, 16 September 2009.
NASA global temperature data
http://data.giss.nasa.gov/gistemp/tabledata_v3/GLB.Ts.txt
NASA, 2002. Global Temperature Anomalies in 0.1C. Goddard Institute for Space Studies., NASA Goddard Space Flight Center, Earth Sciences Directorate.
http://www.giss.nasa.gov/data, updated December 2002
NASA, 2007. "Methane Blast" NASA, May 4, 2007. Test firing of a 7,500 pound thrust LOX/methane engine. Image credit Mike Masseea Aerospace.
http://Science.nasa.gov/science-at-nasa/2007/04may-methaneblast/
NASA, 2012. Atmospheric methane levels. AIRS 2006 - 2009 annual mean upper troposphere (359 Hpa) methane concentration (ppm).
http://daac.gsfc.nasa.gov/giovanni/
NASA, 2011, GISS surface temperature data. SBBX.Tsurf250, (18.9MB) suf air temp (1880-present) 250km smoothing.
ftp://data.giss.nasa.gov/pub/gistemp/download/
NASA, 2012. Global temperature data.
http://data.giss.nasa.gov/gistemp/tabledata_v3/GLB.Ts.txt
Nassar, R., Bernath P.F., Boone, C.D., Manny, G.L., McLeod, S.D., Rinsland, C.P., Skelton, R., Walker, K.A., 2005. Stratospheric abundances of water and methane based on ACE-FTS measurements. geophysical Research Letters, Vol.32, L15504, 5 pp.
http://www/.atmosp.physics.utoronto.ca/~massar/Publications_pdfs/Nassar_water_methane_2005GL022383.pdf
Nataf H.C., Nakanishi I., Anderson D.L., 1986. Measurements of mantle wave velocities and inversion\ for lateral heterogeneities and anisotropy. Part III. Inversion. J. Geophys. Res., 91, 7261 - 7307.
National Snow and Ice Data center (NSIDC), 2011a. The Polar Vortex.
http://nsidc.org/
http://arcticmet/patterns/polar_vortex.html
National Snow and Ice Data center (NSIDC), 2011b. Arctic Climatology and Meteorology,
http://nsidc.org/articmet/factors/winds.html
Naumer T., 2012. Triggering permafrost meltdown is closer than we think.
http://Climatechangepsychology.blogspot.com.es/2012/04/triggering-permafrost-meltdown-
is.html
Neven, 2011. Arctic Sea Ice Blog. Interesting News and Data;
http://neven1.typepad.com/blog/2011/09/piomas-august-2011.html
NOAA 2011a. Huge sudden atmospheric methane spike Arctic Svalbard (north of - Norway)
http://arctic-news.blogspot.com/p/need-for-geo-engineering.html
NOAA 2011b. Huge sudden methane spike recorded at Barrow (BRW), Alaska, United States. Generated ESRL/GMO – 2011. December 14-17-21 pm
http://arctic-news.blogspot.com/p/need-for-geo-engineering.html
NOAA ESRL (2012). Atmospheric Carbon Dioxide Levels, 2009. NOAA ESRL data.
ftp:ftp.cmdl.noaa.gov/ccg/co2/trends/co2_annmean_mlo.txt
NOAA, 1999. Paleoclimatology Program. International Ice Core Data Cooperative.
Vostok Ice Core Data.
http://www.ngdc.noaa.gov/palaeo/icecore/antarctica/vostok/vostok.html
NSIDC 2011a. The Polar Vortex. National Snow and Ice Data Center,
http://nsidc.org/
http://arcticmet/patterns/polar_vortex.html
Norwegian Polar Institute, 2001. Svalbard, Climate:
http://www.npolar.no/en/the-arctic/svalbard/
Nuccitelli D., Way R., Painting R., Church J., Cook J., 2012. Comment on "ocean heat content and Earth's radiation imbalance.II Relation to climate shifts". Physics Letters A. Vol. 376, Issue 45, 1 October 2012, 3466 - 3468.
Olivier, C.P., 1942. Long Enduring Meteor Trains. Proc. Amer. phil. Soc. 35. p.93
Olivier, C.P., 1948. long Enduring Meteor Trains. Proc. Amer. Phil. Soc. 91, p. 315
(second paper).
Parry, M.L., Canziani, O.F., Palutikof, J.P. and Co-authors, 2007. Impacts, Adaption and Vulnerability. Contribution of Working Group II to the Fourth Assessment Report of the Intergovernmental Panel on Climate Change. M.L. Parry, O.F. Canziani, J.P. Palutikof, P.J. van der Linden and C.E. Hanson, Eds. Cambridge University Press, Cambridge, UK, pp. 23 – 78.
Paull et al. 2007. Origin of pingo-like features on the Beaufort Sea Shelf and their possible relationship to decomposing methane hydrates. Geophysical Research Letters 34, L01603.
http://www.agu.org/pobs/crossref/2007/2006GL027977.shtml
Pravettoni, R., 2009. WWF Arctic Feedbacks Report. UNEP.GRID Arendal.
http://www.grida.no/graphicslib/detail/annual-temperatures-increases-for-2001-2005-relative-to-1951-1980-6beo
Perkin R.G. and Lewis F.I. 1984. Mixing in the West Spitsbergen Current. Journal of Physical Oceanography 14 (8), 1315
Peterson J.B., Helium USGS.
http://minerals.usgs.gov/minerals/pubs/commodity/helium/330495.pdf
Petrology (2013). Composition of the Lithospheric mantle. Location map of Udachnaya Kimberlite Fields.
http://petrology.oxfordjournals.org
Reynold N. 2012. Methane hydrate technology fuels a new energy regime.
http://www.methanehydrate.org
Rice D., 2012. Arctic Sea Ice at Lowest Level on Record. Sci-Tech Today. Environment.
http://www.sci-tech-today.com/story.xhtml?story_id=130007AH6NIG
http://www.methanehydrates.org
Rianovosti, 2011. Russian, US scientists set to study methane release in Arctic. ScienceRSS
http://en.rian.ru/science/20110902/166364635.html
Robertscribbler, 2014. Methane monster finding cracks in the Earth's defenses. Is the global methane sink starting to fade.
http://robertscribbler.wordpress.com/2014/04/18/methane-monster-finding-cracks-in-earths-defenses-is-the-global-methane-sink-starting-to-fade
Robertscribbler, 2015. Siberian Methane Crater Locations. In total, 7 methane blow holes with features similar to the Yamal Crater have been discovered.
http://robertscribbler.wordpress.com
Romm J. 2012. Why the Arctic Sea Ice Death Spiral Matters. Think Progress - Climate Progress.
http://thinkprogress.org/climate/2012/08/26/745571/why-the-arctic-sea-ice-death-spiral-matters
Rutgers, 2013a. Atlantic Ocean Gyre Map.
http://www.i-cool.org/wp-content/uploads/2010/02/ce058700fg0010.gif
Rutgers, 2013b. South Atlantic Gyre. I-Cool. International Coalition of Ocean Observing Laboratories.
http://www.i-cool.org/?p=4916
Saldo R. 2012. AIRS data. DTU Space, Technical University of Denmark.
http://www.seaice.dk
Saloranta T.M., Svendsen H. 2001. Across the Arctic front west of Spitsbergen. High-
resolution CTD sections from 1998 - 2000. Polar Research 20 (2). 177. 1751 - 8369.
Science Daily, 2011. Record Depletion of Arctic Ozone Layer Causing Increased UV Radiation in Scandinavia.
http://www.sciencedaily.com/releases/2011/04/110405102202.htm
Scientific American, 2012. Hurricane Sandy: An Unprecidented Disaster.
http://www.scientificamerican.com/report.cfm?id=hurricane-sandy-2012
Scott H.P., Hemley R.J., , Mao H.K., Herschbach D.R., Fried L.E., Howard W.M., Bastea H.S., Generation of Methane in the Earth's Mantle. In situ high pressure - temperature mantle measurements of carbonate reduction. PNAS vol. 101, no. 29. pp 14023 - 14026
http://www.pnas.org/content/101/39/14093.full
Sekretov S.H. 1988. Correction. Petroleum Potential of Laptev Sea Basins. Geological, Tectonic and Geodynamic Factors:In: Polarforschung 68. Tessensohn F., Roland N.W., (eds) ICAMIII. International Conference on Arctic Margins. Celle (Germany). 12 - 16 October, 1998. pp 179 - 186.
Semiletov, I. 2011. Quoted from Itar-Tass. Heavy methane emissions found in the Arctic Eastern Sector. Itar-Tass. September 26, 2011.
http://www.itar-tass.com/en/c154/233799.html
Shakel M., 2005. Sustainability: Our Environment.
http://www.earthethicsinstitute.org/facultycurriculum-pdf/sustainability%20exploration20in%Mathematics.pdf
Shakhova N., 2013. A thawing ocean floor pours methane into the atmosphere and it's only getting worse. PRI. Science. Tech and Environment.
http://www.pri.org/stories/2013-12-12/thawing-ocean-floor-pours-methane-atmosphere-and-its-only-getting-worse
Shakhova N., Semiletov, I., Salyuk, A., and Kosmach, D., 2008. Anomalies of methane in the atmosphere over the East Siberian Shelf. Is there any sign of methane leakage from shallow shelf hydrates? EGU General Assembly 2008. Geophysical Research Abstracts, 10, EGU2008-A-01526
http://www.cosis.net/abstracts/EGU2008/01526/EGU2008-A-01526.pdf
Shakhova, N. and Semiletov, I., 2010a. Methane release from the East Siberian Shelf and the potential for abrupt climate change. Presentation in November 30, 2010.
http://symposium2010.serdp-estcp.org/Technical-Sessions/1A
Shakhova N., Semiletov, I., Leifer, I., Salyuk, A., Rekant, P., and Kosmach, D. 2010b. Geochemical and geophysical evidence of methane release over the East Siberian Arctic Shelf. Journal Geophys. Research 115, C08007
http://europa.agu.org/?view=article&uri=/journals/jc/jc1008/2009jcoo5602/2009jc005602.xml
Shakhova, N., Semiletov, I., Salyuk, A., Yusupov, V., Kosmach, D., and Gustafsson, O., 2010c. Extensive methane venting to the atmosphere from sediments of the East Siberian Arctic Shelf. Science.
http://www.sciencemag.org/content/327/5970/1246.short
Sloan, E.D., 1998. Clathrate hydrates of natural gas. 2nd ed., Marcel Dekker, New York, 705 pp.
Smithson S.B., Wenzel F., Ganchin Y.V., Morozov I.B., 2000. Seismic results at Kola and K.T.B. deep scientific boreholes; velocities, reflections, fluids and crustal composition. Tectonophysics 329 (1-4), 301 - 307. Bibcode. 2000 Tectp 329. 3015. doi; 10. 1016/50040 - 1951 (00)00200-6.
Sohn R.A., et al. 2007. Explosive volcanism on the ultraslow - spreading Gakkel Ridge, Arctic Ocean.
https://darchive.mblwhoilibrary.org/bitstream/handle/1912/2636/2007-12-13258A_text.pdf?sequence=1
Solana, C., and Light, M.P.R., 2002. Can we turn a hazard into a development tool. The case of methane hydrates in the permafrost. Abstract and Poster. EGS, Nice.
Speer K. 2012. How ocean currents affect global climate is a question oceanographers may be close to awnsering. Florida State University.
http://www.eurekalert.org/pub_releases/2012-08/fsu-hoc082612.php
http://www.methanehydrates.org
Sternowski, R.H., 2012. Lecture 7. Softronics ltd.
http://www.softronicsltd.com
Stroeve, J.E., Serreze, M.C., Holland, M.M., Kay, J.E., Malanik, J., and Barret, 2012. The Arctics rapidly shrinking sea ice cover: a research synthesis. Clim. Change. 110, (4.- Mar), p. 1005 - 1027.
Sverdrup, Johnson and Fleming, 1942. In; introduction to Physical Oceanography.
http://oceanworld.tamu.edu/resources/ocng_textbook/chapter 11/chapter11_04.htm
publishing.cdlib.org/ucpressebooks/view?docId=kt167nb66r&doc.view=popup&fig.
ent=http://publishing.cdlib.org/ucpressebooks/data/13030/6r/kt167nb66r/figures/kt167nb66r_fig187.gif
Table 1. (P - T conditions in) Journey to the Center of the Earth.
http://web.ics.purdue.edu/~braile/edumod/journey/journey.htm
Tharp. M., and Frankel, H., 1986. In: Natural History, October 1986. North American Museum of Natural History, p. 1 – 6.
http://www.google.com/url?.sa=t&rt
Thomson L.A., 1988. Elastic Anisotropy due to Aligned Cracks. Geophysics.
Trenberth K., 2014. Deep ocean warming is coming back to haunt us: Record Warmth for 2014 likely as Equatorial Heat Rises.
http://robertscribbler.wordpress.com/2014/05/16/deep-ocean-warming-is-coming-back-to-haunt-us-record-warmth-for-2014
Tschudi, M.A., Stroeve, D.K., Perovich, D.K., and Maslanik, J.A., 2012. Arctic Sea Ice Melt Pond Coverage Derived from Modis and from High Resolution Satellite Imagery. Remote Sensing of the Environment. NSIDC.
http://cires.colorado.edu/websites/nsidc/Publications/publications.php?id=366
Tupolev, 2013. Tu - 155 built to use cyrogenic fuel.
http://www.Tupolev.ru/English/Picture.asp?PubID=1788
University of Washington 2000. "North pole Hydrography 1991 - 2000 compared with EWG Atlas Climatology". EWG Atlas 1950's. Oden 1991. Scicex 1993-1999. North Pole Environmental Observatory 2000. Cast 18.
Velard G. 2006. Inertial Confinement Nuclear Fusion: A Historical Approach by Pioneers. Lawrence Livermore Laboratory Report. UCRL-Book-218579
Vizcarra N. 2012. Arctic Sea Ice Reaches Lowest Extent Ever Recorded. University of Colorado CU- Boulder Research Team.
http://www.eurekalert.org/pub_releases/2012-08/uoca-asi082712.php
Wales J., 2013. 2014.
Wikipedia; Topography of the Arctic Ocean
http://en.wikimedia.org/wikipedia/commons/d/d5/IBCAO_betamap.jpg
Wikipedia, Carbon Dioxide.
http://en.wikipedia.org/wiki/Carbon_dioxide
Wikipedia, Climate of the Arctic.
http://en.wikipedia.org/wiki/climate_of_the_Arctic
Wikipedia; Columbia River Basalt Group
http://en.wikipedia.org/wiki/Columbia_River_Basalt_Group
Wikipedia, Current Sea Level Rise.
http://en.wikipedia.org/wiki/Current_sea_level_rise
Wikipedia, Density of Air.
http://en.wikipedia.org/wiki/Density_of_air
Wikipedia.,2012. Enthalpy of Fusion.
http://en.wikipedia.org/wiki/Enthalpy_of_fusion
Wikipedia; Gakkel Ridge
http://en.wikipedia.org/wiki/Gakkel_Ridge
Wikipedia, Global Warming.
http://en.wikipedia.org/wiki/Global_warming
Wikipedia; Gulf Stream.
http://en.wikipedia.org/wiki/File:Golfstrom.jpg
Wikipedia, Iceberg.
http://en.wikipedia.org/wiki/Iceberg
Wikipedia, Indian Summer.
http://en.wikipedia.org/wiki/Indian_summer
Wikipedia, Jason-1.
http://en.wikipedia.org/wiki/jason-1
Wikipedia; Methane.
http://en.wikipedia.org/wiki/Methane
Wikipedia, Natural Gas.
http://en.wikipedia.org/wiki/Natural_Gas
Wikipedia, North Sea.
http://en.wikipedia.org/wiki/North_Sea
Wikipedia: Schematic Mid-Ocean Ridge
http://upload.wikipedia.org/wikimedia/commons/b/b8/
Wikipedia; South Atlantic Gyre
http://en.wikipedia.org/wiki/File:South_Atlantic_Gyre.png
Wikipedia; West Spitsbergen Current
http://en.wikipedia.org/wiki/West-Spitsbergen-Current
Wikipedia; Sverdrup
http://en.wikipedia.org/wiki/Sverdrup
Weatheronline, 2013.
http://www.weatheronline-co.uk/reports/wxfacts/North-Atlantic-Drift-Gulf-Stream.htm
Westbrook G.K., Thatcher K.E., Rohling E.J., Pitrowski A.M., Palike, H., Osborne A.H., Nisbet E.G., Minshuli, T.A. et al. 2009. Escape of methane gas from the seabed along the West Spitsbergen continental margin. Geophysical Research Letters 36 (15). L15608.
Whitcomb J.H., Garmany J.D., and Anderson D.L., 1973. Earthquake prediction. Variation of seismic velocities before the San Francisco earthquake, 180, 632 - 635.
Whiticar M.J., 1994. Correlation of Natural Gases and their Sources. Chapter 16, Part IV. Identification and Characterisation, AAPG Special Volumes. Volume M60. The Petroleum System - From Source to Trap. pp 261 - 283.
Wignall P. 2009. Miracle Planet: Episode 4, Part 2. Coproduced by NHK (Japan) and the National Film Board of Canada (NFB).
http://www.youtube.com/watch?v=exfNNDExxic&list=PL0200B1S24E220C5A&feature=playerembedded#!
Windley B.F., 1986. The Evolving Continents. 2nd Edition. John Windley and Sons. 399pp.
Winkler H.G.F., 1976. Petrogenesis of Metamorphic Rocks. Fourth Edidtion. Springer - Verlag, New York, 334 pp.
Wofsy, S.C. et al. 2009. (image: HIPPO-1 flight along the date line, January 2009) HIAPER Pole-to-Pole Observations (HIPPO): fine-grained, global-scale measurements of climatically important atmospheric gases and aerosols Phil. Trans. R. Soc. A (2011) 369, 2073–2086 doi:10.1098/rsta.2010.0313
http://rsta.royalsocietypublishing.org/content/369/1943/2073.full.html
Yakovlev A.V., Bushenkova N.A., Koulakov I. Yu., Dobretsov N.L., 2012. Structure of the upper mantle in the Circum - Pacific region from regional seismic tomography. Science Direct. Russian Geology and Geophysics 53, 963 - 971.
http://www.ivan.art.com/sciences/PAPERS/2012_arctic.pdf
Yirka B. 2012. New research explains how diamond rich kimberlite makes its way to Earth's surface. Phys Org.
http://phys.org/news/2012-01-diamond-rich-kimberlite-earth-surface.html
Yurganov, L., 2012a. Atmospheric Infrared Sounder (AIRS) data from NASA's Aqua Satellite. Index of/pub/yurganov/methane/MAPS/
ftp://asl.umbc.edu/yurganov/methane/MAPS/
Yurganov, L., 2012b. Atmospheric Infrared Sounder (AIRS) data from NASA's Aqua Satellite.
ftp://asl.umbc.edu/pub/yurganov/methane/AIRS_CH4%20_2002-2012.jpg
Zhang J. and Rothrock D.A. 2012. Arctic Sea Ice Volume Anomaly, Version 2. Polar Science Center, Applied Physics Laboratory, University of Washington.
http://psc.apl.washington.edu./wordpress/research/projects/arctic-sea-ice-volume-anomaly/
Zhang J. and Rothrock D.A. 2003.. Modelling global sea ice with a thickness and enthalpy distribution model in generalized curvilinear co-ordinates. Mon.Wea.Rev., 131(5), 681 - 697.
Zonenshain L.P., Kuzmin M.I., and Natapov L.M., 1990. Geology of the USSR. A Plate Tectonic Synthesis. AGU Geodynam. Ser. Monogr. 21
Zuppero A., US. Department of Energy, Idaho National Engineering Laboratory - Discovery of Water Ice Nearly Everywhere in the Solar System.
Zwart H.J. and Dornsiepen U.F. 1980. The Variscan and pre - Variscan tectonic evolution of the Central and Western Europe: a Tentative Model. In J. Cogne and M. Slansky (Eds), Geology of Europe. B.R.G.M. Orleans. France. pp 226 - 232.
Figure References
Figure 7. Enhanced Lucy Transmission System. Image from Light and Carana 2012. Lidar methane detecting laser from Ehret, 2012. Methane heating laser from Sternowski, 2012. Hydroxyl formation from iopscience.iop.org, 2013.
North Siberian Arctic Permafrost Methane Eruption Vents | by Malcolm Light, Harold Hensel and Sam Caranahttp://arctic-news.blogspot.com/2015/04/north-siberian-arctic-permafrost-methane-eruption-vents.html
Posted by Sam Carana on Friday, April 10, 2015


