Showing posts with label pre-industrial. Show all posts

Monday, March 18, 2024

Tragedy set to unfold in Tropics (update)

The temperature is rising rapidly in the Tropics (23.5°S-23.5°N, 0-360°E). The image below shows the situation over the years through March 12, 2024, when the average daily surface air temperature was 26.822°C and 1.3°C above 1979-2000.


By comparison, the highest temperature on record was reached on April 24, 2016, when it was 26.827°C, i.e. a little bit higher, but then it was just 1°C above 1979-2000, as the above image also shows. 

The image below shows temperature anomalies over the past few years through February 2024. 
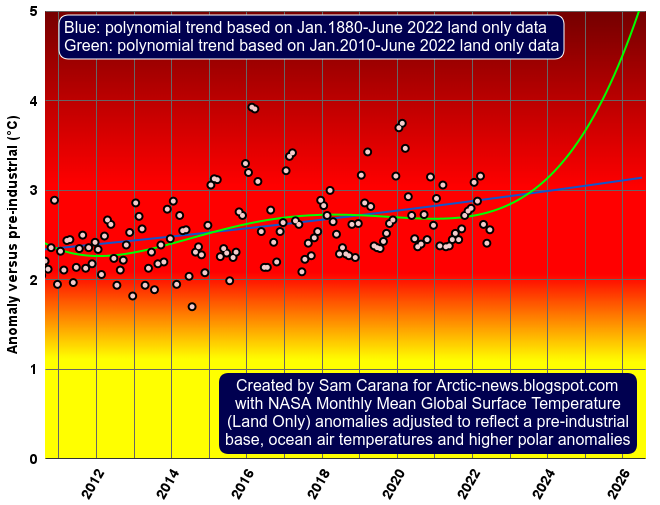

Note that the anomalies in the above images are calculated from different bases. When calculated from a pre-industrial base, anomalies will be higher.
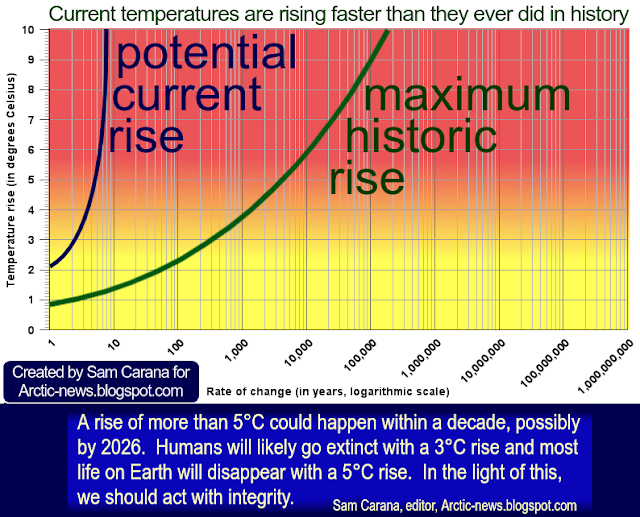
The danger is that tragedy will unfold over the next few months, as temperatures look set to exceed the 2016 peak in the tropics and cause widespread loss of life of people, livestock and wildlife, crop failure and ecosystem collapse in the tropics.

Climate Emergency Declaration

The situation is dire and the precautionary principle calls for rapid, comprehensive and effective action to reduce the damage and to improve the situation, as described in this 2022 post, where needed in combination with a Climate Emergency Declaration, as discussed at this group.


Links

• Climate Reanalyzer
https://climatereanalyzer.org

• Pre-industrial
https://arctic-news.blogspot.com/p/pre-industrial.html

• Extinction
https://arctic-news.blogspot.com/p/extinction.html

• Climate Plan
https://arctic-news.blogspot.com/p/climateplan.html

• Climate Emergency Declaration
https://arctic-news.blogspot.com/p/climate-emergency-declaration.html

Earlier versions of this post are discussed at facebook at:

Wednesday, February 21, 2024

Tragedy set to unfold in tropics

The temperature is rising rapidly in the tropics. The image below shows the situation in the tropics (23.5°S-23.5°N, 0-360°E) through February 14, 2024, when the average daily surface air temperature was 26.3°C, i.e. 1.3°C above 1979-2000.


On April 24, 2016, it was 26.8°C, the highest temperature on record in the tropics, 1°C above 1979-2000, as the above image also shows. The image below shows temperature anomalies over the years. 

Note that the above anomalies are calculated from 1979-2000, which isn't pre-industrial. When calculated from a genuinely pre-industrial base, anomalies will be higher. Also have a look at the recent analysis of sponges collected in the Caribbean, illustrated by the image below. 


According to NOAA, there is a 100% chance that the current El Niño will persist through February-March-April 2024, as illustrated by the image below. 


The danger is that a tragedy will unfold over the next few months as temperatures look set to exceed the 2016 peak in the tropics and cause widespread loss of life of people, livestock and wildlife, crop failure and ecosystem collapse in the tropics.

Climate Emergency Declaration

The situation is dire and the precautionary principle calls for rapid, comprehensive and effective action to reduce the damage and to improve the situation, as described in this 2022 post, where needed in combination with a Climate Emergency Declaration, as discussed at this group.


Links


• Climate Reanalyzer 
https://climatereanalyzer.org

• NOAA - ENSO: Recent Evolution, Current Status and Predictions
https://www.cpc.ncep.noaa.gov/products/analysis_monitoring/lanina/enso_evolution-status-fcsts-web.pdf

• Pre-industrial
https://arctic-news.blogspot.com/p/pre-industrial.html

• 300 years of sclerosponge thermometry shows global warming has exceeded 1.5 °C - by Malcolm McCulloch et al. (2024)  

• Extinction
https://arctic-news.blogspot.com/p/extinction.html

• Climate Plan
https://arctic-news.blogspot.com/p/climateplan.html

• Climate Emergency Declaration
https://arctic-news.blogspot.com/p/climate-emergency-declaration.html

Discussed at facebook:


Friday, November 17, 2023

Arctic Ocean Heatstroke

[ discussed at facebook ]
The above image illustrates how much hotter October 2023 was in the Northern Hemisphere, compared to October in other years. The temperature in October 2023 was more than 2°C above October in 1880-1920, in the Northern Hemisphere, even with 3 years smoothing. Note that 1880-1920 is not pre-industrial, when using a base that is genuinely pre-industrial, the anomaly would be even higher.


The above image, adapted from Climate Reanalyzer, and the image below, adapted from NASA, both use the same 1951-1980 baseline to illustrate the October 2023 temperature anomaly.


Anomalies are very high, especially over the Arctic Ocean, which reflects the enormous amounts of heat that are transferred from the Arctic Ocean to the atmosphere.

There are further reasons behind the very high anomalies over the Arctic, one of which is methane, which has risen very fast over the years.

The image on the right illustrates methane's historic rise, showing IPCC and, more recently, WMO data. Methane (CH₄) reached 1923 parts per billion (ppb) in 2022, 264% of the 1750 level, while carbon dioxide (CO₂) reached 417.9 parts per million (ppm) in 2022, 150% of the 1750 level, and nitrous oxide (N₂O) reached 335.8 ppb, 124% of the 1750 level.

This image below shows some very high hourly average methane levels recently recorded at Barrow, Alaska.


The image below shows high monthly methane levels at Mauna Loa, Hawaii, U.S. 


The image below, created with a Copernicus forecast for November 15, 2023 03 UTC, shows very high methane levels over the Arctic at 500 hPa.


The image below shows that the NOAA-20 satellite recorded high methane levels over the Arctic Ocean, especially north of Alaska, on November 15, 2023 AM at 399.1 mb.

The image below shows methane levels as high as 2700 ppb recorded by the MetOp-B satellite on November 17, 2023 PM at 293 mb.


The image below shows high methane levels over Greenland recorded by the MetOp-B satellite on November 18, 2023 PM at 399 mb.


The image below shows mean methane levels of 1942 ppb recorded by the MetOp-B satellite on November 19, 2023 PM at 399 mb.


The Argo Float 6904087 compilation image below illustrates that the highest water temperatures in the Arctic Ocean can occur at a depth of about 250 meters.

[ click on images to enlarge ]
The Argo Float 6901934 compilation image below illustrates that the highest water temperatures in the Arctic Ocean can occur at a depth of about 250 meters.

[ click on images to enlarge ]
Arctic Ocean surface temperatures are strongly influenced by air temperatures and seasons, ranging from more than 10°C to as low as -1.8°C when there is sea ice.

[ from earlier post ]
By contrast, the water temperature below the surface can remain stable throughout the year at close to 0°C all the way down to 2000 meters without freezing, due to higher salinity. However, the water temperature can be well above 0°C throughout the year at a depth of a few hundred meters, which is worrying since much of the water is less than 200 m deep where the continental shelves extend into the Arctic Ocean (light blue map on the right) and methane hydrates at the seafloor there could instantly be destabilized by a sudden influx of warm water from the North Atlantic. 

Over the next few months, as sea ice keeps growing in extent, this seals off the Arctic Ocean from the atmosphere. This makes it harder for heat to get transferred from the Arctic Ocean to the atmosphere and increases the danger that more heat will reach sediments located at the seafloor and cause methane to be released from hydrates as well as methane that is present in the form of free gas underneath the hydrates.

The danger is illustrated by the image below, adapted from Climate Reanalyzer, which shows a rise in temperature (2 m) by 2100 compared to 1852-1900 using a CMIP6 SSP585 model. 


[ image from the Extinction page ]
Note that none of the bases used in the above images is pre-industrial, neither 1880-1920, nor 1951-1980, nor 1852-1900. Using a base that is genuinely pre-industrial base would result in even higher anomalies. The image on the right shows a 2.29°C 2020 anomaly from 3480 BC.  

Note also that even a small temperature rise (of less than 1°C) can destabilize a vulnerable methane hydrate, which can cause an eruption that in turn can destabilize neighbouring hydrates, resulting in a self-reinforcing feedback loop of methane releases, including methane in the form of free gas from underneath the hydrates. This can drive up temperatures very rapidly. 

Seafloor methane is only one out of many elements that could jointly cause a temperature rise of over 10°C within a few years, in the process causing the clouds tipping point to get crossed that can push up the temperature rise by a further 8°C, as illustrated by the image on the right, from the extinction page.

Conclusion

The precautionary principle calls for comprehensive and effective action to reduce the damage and to improve the situation, along the lines of this 2022 post in combination with a declaration of a climate emergency.


Links

• Climate Reanalyzer
https://climatereanalyzer.org/research_tools/monthly_maps

• NASA Temperature anomaly October 2023

• WMO Greenhouse Gas Bulletin No. 19 – 15 November 2023

• Copernicus - Methane forecasts


Sunday, September 24, 2023

September 2023, highest anomaly on record?


The above image shows the temperature in 2023 as a bold black line, up to September 22, 2023, with the temperature reaching an anomaly of 1.12°C above the 1979-2000 mean for that day.


The above image shows the temperature anomaly from the 1979-2000 mean. In blue are the years 1979-2022 and in black is the year 2023 up to September 25, 2023. A trend is added in pink based on 2023 data. 

[ click on images to enlarge ]
Note that 1979-2000 isn't pre-industrial, the anomaly from pre-industrial is significantly higher. 

It looks like September 2023 will be the month with the highest temperature anomaly on record and the year 2023 will be the hottest year on record. 

The question is whether temperatures will keep rising. The current El Niño is still strengthening, as illustrated by the image on the right, adapted from IRI, and there is more to be taken into account. 


Until now, February 2016 has been the hottest month on record. The above image, from an earlier post, shows that February 2016 was 3.28°C (5.904°F) hotter than 1880-1896 on land, and 3.68°C (6.624°F) hotter compared to February 1880 on land. Note that 1880-1896 is not pre-industrial either and that sustained anomalies higher than 3°C are likely to drive humans into extinction. The image adds a poignant note: Looking at global averages over long periods is a diversion, peak temperature rise is the killer!

The situation raises questions. How much has the temperature risen? Will the temperature keep rising? What can be done about it? How can these questions best be answered?

The Paris Agreement mandate


During the UN Climate Change Conference scheduled to be held from November 30 to December 12, 2023, in Dubai, United Arab Emirates, the first Global Stocktake of the implementation of the Paris Agreement will be concluded.

The 2015 Paris Agreement mandate: Holding the increase in the global average temperature to well below 2°C above pre-industrial levels and pursuing efforts to limit the temperature increase to 1.5°C above pre-industrial levels by undertaking rapid reductions in emissions in accordance with best available science.

Many assume that the temperature rise will only threaten to cross 1.5°C above pre-industrial in the second half of this century and that by that time action will have stopped the temperature from rising, with the idea that an increase in carbon sequestration could make up for remaining emissions and avoid dangerous climate change. 

The question is whether such assumptions and decisions are indeed based on best available science, as opposed to political whim. Indeed, politicians are vulnerable to collusion with lobbyists feeding suggestions that there was a carbon budget to divide among polluters to enable polluters to keep polluting for decades to come. Local People's Courts can best rule on such questions, after taking a closer look at points such as the following: 

  • Rise from pre-industrial - While many politicians keep pushing the idea that 1.5°C above pre-industrial hasn't been crossed yet, we may already have crossed 2°C above pre-industrial, as discussed in this analysis.

  • Policy choices - emission reductions are best achieved early, rather than late. Yet, many politicians keep supporting fuel (fossil fuel and biofuels) and envisage burning of fuel to continue well beyond 2050 (combined with BECCS). Instead, when taking into account damage to health and the environment, and the danger of runaway temperature rise, it should be clear that better policies must be implemented soon, such as local feebates, to support better methods and technologies such as biochar, heat pumps and eVTOL air taxis. 

  • Rising emissions - Politicians claim that merely stating to aim for net-zero emissions will suffice to reduce emissions, whereas the evidence shows that energy-related greenhouse gas emissions have started to grow again, following minor Covid lockdown-related reductions in 2020, as illustrated by the image below, from an earlier post
[ Global energy-related greenhouse gas emissions 2000-2022, adapted from EIA ]
  • Carbon sink loss - Carbon sinks have long been taking carbon out of the atmosphere, but they are struggling and many may turn from sinks into sources and instead add carbon to the atmosphere. In 2023, nearly 2bn tons of carbon is estimated to have already gone up into the atmosphere in Canada up to now due to forest fires, far exceeding annual emissions tied to Canada’s economy (i.e. 670m tons). As temperatures rise, trees become more vulnerable to diseases and insects such as bark beetles. A 2020 study shows that at higher temperatures, respiration rates continue to rise in contrast to sharply declining rates of photosynthesis. Under business-as-usual emissions, this divergence elicits a near halving of the land sink strength by as early as 2040. As temperatures rise, soils and vegetation will lose moisture to the atmosphere. The Land Evaporation Tipping Point can get crossed locally when water is no longer available locally for further evapotranspiration from the soil and vegetation, with the rise in land surface temperatures accelerating and vegetation decaying accordingly. Higher temperatures result in more extreme weather events, such as fires, droughts, storms, flooding and erosion, that can all contribute to further decrease the terrestrial carbon sink. The ocean is also struggling as a carbon sink, in part because increased river runoff and meltwater lowers alkalinity levels. Furthermore, warmer water holds less oxygen and is becoming more stratified and thus less able to supply nutrients to help plankton grow and store carbon

  • Hydroxyl loss - There is a danger that hydroxyl, the main way that methane gets broken down in the atmosphere, is declining or getting overwhelmed by the rise in methane, as described here.

  • Heat sink loss - This recent study and this one warn that AMOC (the Atlantic meridional overturning circulation) is slowing down faster than expected. A recent post warns that this can contribute to more hot water accumulating in the North Atlantic, as opposed to moving to greater depth. The post also warns that, as temperatures rise, less heat gets stored in oceans, because stratification increases and more heat can get transferred from oceans to the atmosphere as sea ice disappears. There also are indications that, over time, proportionally more heat is remaining in the atmosphere, while less heat gets stored on land. All this results in a hotter atmosphere. 
     
  • Albedo loss - Loss of sea ice, loss of snow cover and warming oceans causing fewer bright clouds combine to reflect less sunlight back into space, as discussed here and here
  • [ Two out of numerous feedbacks ]
    Feedbacks - Important also is the accelerating rate of change. In many respects, we're in uncharted territory and changes are occurring faster than ever in Earth's history, which should be reason for caution and even more reason to plan ahead!

    The danger is growing that feedbacks are kicking in with ever greater ferocity, i.e. non-linear change. The image on the right, from an earlier post, illustrates how two self-reinforcing feedback loops can contribute to accelerate the Arctic temperature rise.

    [ click on images to enlarge ]
  • [ see the Extinction page ]
    Tipping Points - An even more dramatic form of non-linear change occurs when tipping points get crossed, and the consequences can be catastrophic for the entire world.

    The above image, from an earlier post, illustrates the danger that, as the latent heat and seafloor methane tipping points get crossed, the ocean temperature will keep rising as huge amounts of methane get released in the Arctic.

    It is essential to assess the danger of events and developments such as heat reaching and destabilizing methane hydrates contained in sediments at the seafloor of the Arctic Ocean, as discussed in many earlier posts such as this one.

    Seafloor methane is one of many elements that could jointly cause a temperature rise of over 10°C, in the process causing the clouds tipping point to get crossed that can push up the temperature rise by a further 8°C, as illustrated by the image on the right, from the extinction page

    Ominously, very high methane levels continue to be recorded at Barrow, Alaska, as illustrated by the NOAA image below.

Conclusion

Alarms bells have sounded loud and clear, such as here, warning that the temperature rise could be more than 3°C as early as in 2026. The precautionary principle should prevail and the looming dangers should prompt people into demanding comprehensive and effective action to reduce the damage and to improve the situation. To combat rising temperatures, a transformation of society should be undertaken, along the lines of this 2022 post in combination with a declaration of a climate emergency.


Links

• Climate Reanalyzer

• The International Research Institute for Climate and Society, Columbia University Climate School 

• Paris Agreement

• International Energy Agency (IEA) - Global energy-related greenhouse gas emissions 2000-2022

• NOAA - Barrow Atmospheric Baseline Observatory, United States
https://gml.noaa.gov/dv/iadv/graph.php?code=BRW&program=ccgg&type=ts

• Transforming Society
https://arctic-news.blogspot.com/2022/10/transforming-society.html

• Climate Plan
https://arctic-news.blogspot.com/p/climateplan.html

• Climate Emergency Declaration
https://arctic-news.blogspot.com/p/climate-emergency-declaration.html


Wednesday, July 13, 2022

Human Extinction by 2025?

Most important metric

Kevin Trenberth et al. suggest in a recent article that Earth's energy imbalance, defined as the absorbed solar radiation minus the net outgoing longwave radiation, is arguably the most important metric related to climate change. Of the extra heat from Earth's energy imbalance, about 93% ends up in the ocean as increasing ocean heat content (see image below), 3% goes into melting ice, 4% goes into raising temperatures of land and melting permafrost, and less than 1% remains in the atmosphere. 


One could also argue that the most important metric related to climate change is the monthly mean surface temperatures on land, as illustrated by the image below that was created with a July 16, 2022 screenshot from NASA customized analysis plots and shows that the February 2016 (land only) anomaly from 1886-1915 was 2.94°C or 5.292°F. 


Land only anomalies are important. After all, most people live on land and humans will likely go extinct with a rise of 3°C above pre-industrial, as illustrated by the image below, from an analysis in earlier post.


Note that in the above plot, anomalies are measured versus 1886-1915, which isn't pre-industrial. The image raises questions as to what the temperature rise would look like when using a much earlier base, and how much temperatures could rise over the next few years.  

Potential for temperature rise on land

The image below shows land only surface temperature anomalies, similar to the above image but further adjusted by almost a degree to reflect a pre-industrial base, ocean air temperatures and higher polar anomalies, as discussed at the pre-industrial page.


The image features two trends. The blue trend is based on January 1880-June 2022 land only data and shows the potential for 3°C to be crossed on land and to drive humans into extinction by 2025. The green trend is based on January 2010-June 2022 land only data and shows the potential for 5°C to be crossed on land by 2026, which will likely drive most life on land into extinction. 

A temperature rise of 3°C would likely stop all activities by humans, including their emissions, yet temperatures could keep rising.

Could
 temperatures keep rising?

In the video below, Guy McPherson discusses Abrupt, Irreversible Climate Change to Cause Planetary Extinction.


Concentrations of greenhouse gases in the atmosphere constitute yet another important metric related to climate change. Carbon dioxide at Mauna Loa in June 2022 was 420.99 ppm, a joint record high with May 2022, as illustrated by the above image. Methane and nitrous oxide concentrations are also at record high since 1750, as illustrated by the image on the right, from an earlier post

Greenhouse gas concentrations this high are likely to keep adding ocean heat for some time, causing further melting of sea ice, etc.

All these metrics are important, including Earth's energy imbalance, concentrations of greenhouse gases in the atmosphere, and monthly land only surface temperature anomalies.

Greenhouse gases remain in the atmosphere for many years, so even if emissions by people's activities stop now, concentrations of greenhouse gases that have a long lifetime are unlikely to fall much over the next few years, while there would be additional emissions (such as carbon monoxide) from decomposing biomass, forest fires and waste fires globally that would also make it hard for concentrations of shorter-lived methane to fall, as also discussed here.

We're also moving into a new El Niño, as illustrated by the image on the right. The difference between the top of El Niño and the bottom of La Niña could be more than half a degree Celsius, as the NOAA image below shows. The upcoming El Niño may well coincide with a peak in sunspots in 2025, further pushing up temperatures, as also discussed in the post Cataclysmic Alignment, which also mentions a recent study that warns that the combined impact of aerosols and nitrogen fertilizers can contribute much more strongly than previously thought to the formation of cirrus clouds that contribute to global warming. 


The resulting heatwaves and fires could trigger massive blackouts and, as civilization grinds to a halt, this could cause much of the sulfate masking effect to fall away almost instantly, resulting in further acceleration of the temperature rise. 

All this looks set to contribute to keep temperatures rising for years to come, with the danger of increasing ocean temperatures to the point where there would be massive eruptions of seafloor methane that contribute to the clouds tipping point at 1200 ppm CO₂e to be crossed, which in itself would push up temperatures by a further 8°C and cause rapid extinction of most life on Earth, as this 2019 analysis and this and this more recent analyses warn.

[ from earlier post ]

The clouds tipping point could be crossed as a result of seafloor methane releases. There is potential for such releases, given the rising ocean heat and the vast amounts of methane present in vulnerable sediments at the seafloor of the Arctic Ocean, as discussed in posts such as this one. If methane concentrations would increase in line with the trend in the above mage, i.e. methane reaching 780 ppm CO₂e by 2028 using a 1-year GWP of 200, this plus a concentration of carbon dioxide of 420.99 ppm as in the image further above would suffice to cause the clouds tipping point to be crossed. When adding further forcers, this could happen even earlier.

[ click on images to enlarge ]
Altogether, the global temperature could rise by more than 18°C above pre-industrial within a few years, as also discussed at the Extinction page. Even the longer-term outlook doesn't look promising. A 2020 analysis by Jorgen Randers et al. points out that, even if all greenhouse gas emissions by people could stop immediately and even if the temperature anomaly could fall to 0.5°C above pre-industrial, greenhouse gas levels would start rising again after 2150 and keep rising for centuries to come, while, as discussed in an earlier post, a 2016 analysis by Ganapolski et al. suggests that even moderate anthropogenic cumulative carbon dioxide emissions would cause an absence of the snow and ice cover in the next Milankovitch cycle, so there would be no buffer at the next peak in insolation, and temperatures would continue to rise, making the absence of snow and ice a permanent loss for millennia to come.

Conclusion

In an earlier post, the following question was also discussed: Could temperatures keep rising? This post concludes that surface temperatures on land could rise strongly over the next few years and drive humans into extinction as early as in 2025. Temperatures could continue to rise afterwards and drive most life on Earth into extinction soon thereafter, making it the more important to do the right thing now and help avoid the worst from happening, through comprehensive and effective action as described in the Climate Plan.

Our duty to support local people's courts that administer local feebates 

The disregard for science and democracy by those in power has now become so apparent and appalling that we, the people, must agree that the best way forward is to institute Local People's Courts in which randomly-chosen residents administer local feebates, as a superior form of democracy and decision-making.

Elections do allow people to participate in decisions regarding their own lives and future, but elections only give people a single choice every few years between representatives who then take decisions of importance for them. While this can be regarded as a shallow form of democracy, it is now sufficiently clear that elections effectively remove people's participation in such decisions and deteriorate the outlook and future for people and the environment locally and globally.

Residents should participate in decisions regarding their own lives and environment by supporting Local People's Courts that administer local feebates, with fees added to the sales price of polluting products and to rates on degraded land, and with revenue of fees used to fund support for improvements, such as through rebates on cleaner products sold locally or rebates on local rates on improved land. Local People's Courts can best ensure that choices regarding percentages and eligibility of fees and rebates are science-based, while feebates leave the choice as to what to buy or sell to individuals.

[ image from earlier post ]


Links

• A perspective on climate change from Earth's energy imbalance - by Kevin Trenberth et al. 
https://iopscience.iop.org/article/10.1088/2752-5295/ac6f74

• Another Record: Ocean Warming Continues through 2021 despite La Niña Conditions - by Lijing Cheng et al. 
https://link.springer.com/article/10.1007/s00376-022-1461-3

• Improved Quantification of the Rate of Ocean Warming - by Lijing Cheng et al. 
https://journals.ametsoc.org/view/journals/clim/35/14/JCLI-D-21-0895.1.xml

• NASA - GISS Surface Temperature Analysis 


• An earth system model shows self-sustained thawing of permafrost even if all man-made GHG emissions stop in 2020 - by Jorgen Randers et al.
https://www.nature.com/articles/s41598-020-75481-z

• Could temperatures keep rising?

• Critical insolation–CO2 relation for diagnosing past and future glacial inception - by Andrey Ganapolski et al. (2016)
https://www.nature.com/articles/nature16494

• NOAA - Trends in Atmospheric Carbon Dioxide - Mauna Loa, Hawaii 
https://gml.noaa.gov/ccgg/trends/graph.html

• Will COP26 in Glasgow deliver?
• Impact of interannual and multidecadal trends on methane-climate feedbacks and sensitivity - by Chin-Hsien Cheng et al.
https://www.nature.com/articles/s41467-022-31345-w

• NOAA - ENSO: Recent Evolution, Current Status and Predictions
https://www.cpc.ncep.noaa.gov/products/analysis_monitoring/lanina/enso_evolution-status-fcsts-web.pdf

• NOAA - Monthly Temperature Anomalies Versus El Niño

• Cataclysmic Alignment 
https://arctic-news.blogspot.com/2022/06/cataclysmic-alignment.html

• Sunspots
https://arctic-news.blogspot.com/p/sunspots.html

• Methane rise is accelerating

Thursday, November 4, 2021

The exclusion of climate science from COP meetings

 by Andrew Glikson

There can be little doubt that, had the US, China and Russia been on the same page, an advanced agreement was likely to be reached at COP26, but since it is not, the collapse can be laid at the feet of human tribalism and eternal conflict since the dawn of civilization, ultimately leading to a mass extinction of species.

Climate scientists have practically been excluded from COP meetings, dominated as they are by economists, lawyers and politicians. To date no address has been made by leading climate scientists, including authorities such as James Hansen, Michael Mann, Joachim Schellnhuber, Will Steffen and other, leaving delegates and populations unaware of the ultimate consequences of global climate devastation.

With the exception of David Attenborough and references to “one minute to mid-night”, the science-based projections of global heating have only received faint echoes among the assembly of warring tribes at COP-26, dominated by nationalism, vested interests and sheer ignorance of the current trend, which can only culminate in the end of civilization.

The futility of making political decisions regarding future carbon emissions while continuing to grow fossil fuel industries is manifest (Figure 1).

Figure 1. Global CO₂ emissions by fuel (Global Carbon Project)

The lessons from climate science indicate:
  1. While politicians talk about a 1.5°C target, the mean global temperature has already exceeded this level and likely approaches 2°C when the transient short-term masking effects of aerosols are accounted for. Thus Hansen and Sato (2012) estimate aerosol to lower global temperatures by between -1.0°C and -1.2°C, which implies the real mean global temperatures are close to +2°C above pre-industrial level. By contrast, references to the NASA’s ~1.02°C warming can be compared to a measurement of a patient’s body temperature only after they take a dose of aspirin. Furthermore, this NASA anomaly is measured from 1951-1980, whereas the Paris Agreement calls for a pre-industrial base.

  2. Whereas the critical need for emissions reduction is central to climate negotiations, the effects of cumulative concentration of GHG in the atmosphere (CO₂ + equivalent CH₄, N₂O, etc), which trigger amplifying feedbacks from land and ocean, remains hardly tackled. The current CO₂-equivalent level of >500 ppm (Figure 2), which is near X1.8 times the pre-industrial level of ~280 ppm CO₂, is generating amplifying feedbacks. According to a climate sensitivity estimate of 3 ± 1.5°C per doubling of CO₂ the equilibrium rise in temperature could be approaching +3°C.

  3. The role of amplifying GHG feedbacks from land and oceans, leading to enhanced heating, appears to be neglected in climate talks, including:
    - A decline in the polar albedo (reflection) due to large-scale lateral and vertical melting of ice;
    Reduced CO₂ intake by warming oceans. Currently the oceans absorb between 35-42% of all CO₂ and around 90% of the excess heat;
    - Warming, desiccation, deforestation and fires over land areas;
    - Release of methane from melting permafrost and from polar sediments;
    - An increase in evaporation, particularly in arid zones, raising atmospheric vapor levels, which enhances the greenhouse gas effect.

  4. IPCC-based climate trends are mostly linear, yielding an impression that overshooting of the warming trend is capable of being reversed within acceptable time scales, projections which neglect the likelihood of tipping points of no return. The time scales for attempts to cool the atmosphere may exceed the longevity of civilization. The weakening of the Arctic jet stream, allowing air and water masses of contrasted temperatures to cross the Arctic boundary, leads to disruptions such as the freezing “beast from the east” fronts that hit North America and Europe and Arctic wildfires. The flow of ice melt water from Greenland and Antarctica into the oceans may result in marked transient temperature reversals in the oceans, extending onto land.
While neglecting the consequences of runaway global warming, discussions continue of the price of mitigation and adaptation, i.e. the price of habitability of Earth, proceeding to huggle in terms akin to corner store grocers. Elsewhere, much of the media appears to be preoccupied with the price of submarines, deadly weapons in futile wars, ironically more suitable for coastal surveys of regions flooded by an inevitable sea level rise on the scale of many meters.


Andrew Glikson
A/Prof. Andrew Glikson

Earth and Paleo-climate scientist
School of Biological, Earth and Environmental Sciences
The University of New South Wales,
Kensington NSW 2052 Australia

Books:
The Asteroid Impact Connection of Planetary Evolution
https://www.springer.com/gp/book/9789400763272
The Archaean: Geological and Geochemical Windows into the Early Earth
https://www.springer.com/gp/book/9783319079073
Climate, Fire and Human Evolution: The Deep Time Dimensions of the Anthropocene
https://www.springer.com/gp/book/9783319225111
The Plutocene: Blueprints for a Post-Anthropocene Greenhouse Earth
https://www.springer.com/gp/book/9783319572369
Evolution of the Atmosphere, Fire and the Anthropocene Climate Event Horizon
https://www.springer.com/gp/book/9789400773318
From Stars to Brains: Milestones in the Planetary Evolution of Life and Intelligence
https://www.springer.com/us/book/9783030106027
Asteroids Impacts, Crustal Evolution and Related Mineral Systems with Special Reference to Australia
https://www.springer.com/us/book/9783319745442
The Event Horizon: Homo Prometheus and the Climate Catastrophe
https://www.springer.com/gp/book/9783030547332
The Fatal Species: From Warlike Primates to Planetary Mass Extinction
https://www.springer.com/gp/book/9783030754679