Showing posts with label smoke. Show all posts

Sunday, June 25, 2023

Extreme heat stress

Heatwaves

High Wet Bulb Globe Temperature (WBGT) is forecast to hit the Southeastern United States over the next few days. The image below shows a forecast for June 29, 2023, 18 UTC with WBGT as high as 34°C (93°F) forecast for a location near Jackson, Mississippi, U.S. 

[ click on images to enlarge ]

WBGT is a measure used by weather.gov to warn about expected heat stress when in direct sunlight. It estimates the effect of temperature, relative humidity, wind speed, and solar radiation on humans using a combination of temperatures from three thermometers:

  • A Wet bulb measures the temperature read by a thermometer covered in a wet cloth. As water evaporates from the cloth, evaporation cools the thermometer. This mirrors how the human body cools itself with sweat.
  • A black globe is used to measure solar radiation. Solar radiation heats the globe and wind blowing across it cools the globe.
  • A Dry bulb calculates the air temperature measured in the shade. It is the temperature you would see on your thermometer outside.
The images on the right earlier featured in a 2016 post

The top image, an animation from the EPA, illustrates that a relatively small rise in average temperature can have a huge impact and result in a lot more hot weather as well as in even more extreme hot weather.

[ from earlier post ]
The three images underneath, from the IPCC, show the effect on extreme temperatures when (a) the mean temperature increases, (b) the variance increases, and (c) when both the mean and variance increase for a normal distribution of temperature.

The thermodynamic wet-bulb temperature is determined by temperature, humidity and pressure (hPa), and it is the lowest temperature that can be achieved by evaporative cooling of a water-wetted ventilated surface.

As temperatures and humidity levels keep rising, there comes a point where the wind factor no longer matters, in the sense that wind can no longer provide cooling.

The human body can cool itself by sweating, which has a physiological limit that was long described as a 35°C wet-bulb temperature. Once the wet-bulb temperature reaches 35°C, one can no longer lose heat by perspiration, even in strong wind, but instead one will start gaining heat from the air beyond a wet-bulb temperature of 35°C. 

Accordingly, a 35°C wet-bulb temperature (equal to 95°F at 100% humidity or 115°F at 50% humidity) was long seen as the theoretical limit, the maximum a human could endure. 

A 2020 study (by Raymond et al.) warns that this limit could be regularly exceeded with a temperature rise of less than 2.5°C (compared to pre-industrial). A 2018 study (by Strona & Bradshaw) indicates that most life on Earth will disappear with a 5°C rise. Humans, who depend for their survival on many other species, will likely go extinct with a 3°C rise, as illustrated by the image below, from an earlier post.


A 2022 study (by Vecellio et al.) finds that the actual limit is lower — about 31°C wet-bulb or 87°F at 100% humidity — even for young, healthy subjects. The temperature for older populations, who are more vulnerable to heat, is likely even lower. In practice the limit will typically be lower and depending on circumstances could be as low as a wet-bulb temperature of 25°C.

The images below show high readings on the 'Misery Index', the perceived temperature that is used by nullschool.net, combining wind chill and the heat index (which in turn combines air temperature and relative humidity, in shaded areas).

The image below shows a forecast for June 29, 2023 20 UTC, with weather conditions prolonged by circular wind patterns at 250 hPa (Jet Stream), while the Jet Stream is crossing the Equator (bottom left). Temperatures as high as 39.9°C (103.7°F) combined with a relative humidity of 35% result in perceived temperatures as high as 45°C (112.9°F) at the green circle.


As it turned out, the perceived temperature was as high as 44.9°C or 112.7°F on June 29, 2023 19 UTC, due to a 39.1°C or 102.5°F temperature and a 38% relative humidity at the surface, and with conditions prolonged by a distorted Jet Stream (at 250 hPa), with circular wind patterns and winds crossing the Equator.


The image below shows high readings on the 'Misery Index' for parts of Pakistan. On June 22, 2023, an air temperature of 45.4°C (113.7°F) and a relative humidity of 25% resulted in a perceived temperature of 51°C (123.7°F) at the area marked by the green circle. 


The above image also shows the Jet Stream (wind at 250 hPa). Distortion of the Jet Stream can lead to circular wind patterns that amplify heatwaves. As temperature rise, the temperature difference between the Equator and the Arctic narrows, distorting the Jet Stream resulting in more extreme  weather.

Perceived (feels like) air temperatures as high as 53.1°C or 127.7°F were recorded in Pakistan on July 4, 2023, 09 UTC (at green circle), with a 46.7°C or 116.1°F temperature and a 24% relative humidity recorded at the surface. Also, Jet Stream deformation shows up (at 250 hPa), with circular wind patterns and wind crossing the Equator (at the image bottom).


Meanwhile, heatwave conditions have also been affecting China, Texas and Mexico recently, with all-time high temperature records broken in each of these places. 

The press release of a 2022 Unicef report has the title 559 million children currently exposed to high heatwave frequency, rising to all 2.02 billion children globally by 2050

Fire and smoke from fires

An additional hazard is fire and the smoke from fires. The image below shows biomass-burning aerosols from fires in Canada extending over the North Atlantic on June 25, 2023, 03 UTC.


The forecast for June 29, 2023 21 UTC below shows remnants of the Canadian forest fires reaching Western Europe.


Feedbacks

As temperatures rise, fire and smoke hazards increase due to self-reinforcing feedback loops, including: 
  • [ Two out of numerous feedbacks ]
    Albedo loss and Jet Stream distortion:
    - as sea ice melts away and gets covered by meltpools and rainwater pools, soot, dust, and algae, the resulting albedo loss further pushes up temperatures
    - the narrowing temperature difference between the Arctic and the Tropics causes Jet Stream distortion, resulting in more extreme weather, incl. stronger storms that come with more lightning and can carry more oxygen to fires and spread fires faster and wider, and more intense heatwaves that can dramatically push up local temperatures, further intensifying droughts and forest fires
  • a further self-reinforcing feedback loop is that water that was previously present in the soil, is increasingly moving up into the atmosphere, as the atmosphere sucks up more water vapor (7% more water vapor for every 1°C in temperature rise ), resulting in:
    - less evapotranspiration from vegetation, in turn resulting in less clouds and rain, thus pushing up temperatures and drying out soil and vegetation even more
    - erosion and less healthy vegetation that is more vulnerable to pests and diseases such as bark beetles, resulting in an increase in dead trees providing more fuel for fires
[ from earlier post ]
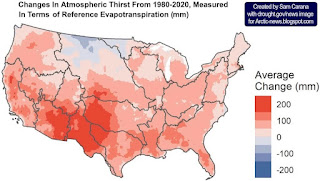
The image on the right, from a news release associated with a 2022 study, shows changes in atmospheric thirst, measured in terms of reference evapotranspiration from 1980-202 (in mm).

As temperatures rise due to people's emissions, more evaporation will take place over both land and oceans, but not all water will return as precipitation, so more water vapor will stay in the air and droughts affecting the soil and vegetation will intensify.

[ from earlier post ]
Water in the soil acts as a buffer, slowing down the temperature rise, so drier soil will heat up faster and further, causing land surface temperatures to rise even more and amplifying the impact of Urban heat island and Heat dome phenomena.

The image on the right, adapted from ESA, shows land surface temperatures as high as 65°C (149°F) in India on April 26, 2022. Note that land surface temperatures can be substantially higher than air temperatures.

The Copernicus image below shows Spain on 11 July 2023, where the Land Surface Temperature (LST), i.e. the temperature of the soil, in some areas of Extremadura (Spain) exceeded 60°C or 140°F, as measured by the Sea and Land Surface Temperature Radiometer (SLSTR) instrument, a feature of the Copernicus Sentinel-3 satellites. 


How high could temperatures rise?

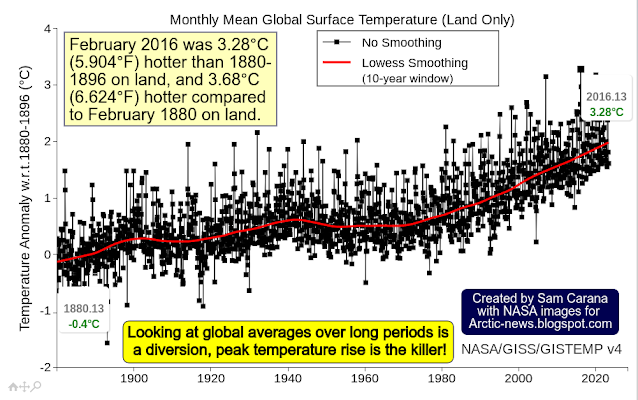
The image below, from NASA, shows that February 2016 was 3.24°C or 5.83°F hotter on land than 1850-1890. Note that 1850-1890 is not pre-industrial, while the 2016 peak was reached during an El Niño, which raises the question how much hotter than pre-industrial it will be at the peak of the current El Niño. 


The image below says it even more poignantly: Looking at global averages over long periods is a diversion, peak temperature rise is the killer!

The above image shows that February 2016 was 3.28°C (5.904°F) hotter than 1880-1896 on land, and 3.68°C (6.624°F) hotter compared to February 1880 on land.


World temperature was at a new record high of 17.18°C or 62.92°F on July 4, 2023 (black). Both in 2022 (orange) and in 2016 (grey), the temperature reached 16.92°C or 62.46°F (on July 24, 2022 and August 13+14, 2016). The year 2016 is important, since it was a strong El Niño year and we're now again in an El Niño.

A 2023 study led by Tao Lian predicts the current El Niño to be strong. Moving from the bottom of a La Niña to the peak of a strong El Niño could make a difference of more than half a degree Celsius, as discussed in an earlier post.

Additionally, the June 2023 number of sunspots is more than twice as high as predicted, as illustrated by the image on the right, adapted from NOAA.

Furthermore, the 2022 Tonga submarine volcano eruption did add a huge amount of water vapor to the atmosphere, as discussed in an earlier post.

Alarm bells have been ringing for many years. As an example, the image below featured in a 2015 post, showing non-linear trends including a polynomial trendline (1: blue) pointing at global temperature anomalies of over 4°C by 2060. 

Moreover, a polynomial trend for the Arctic (2: red) threatens to cause major feedbacks to kick in, triggering runaway global warming (3: white) that looks set to catch up with accelerated warming in the Arctic and result in global temperature anomalies of 16°C by 2052.
[ from a 2015 post, click on image to enlarge ]
In the 2019 video below, Roger Hallam talks with Stephen Sackur from the BBC's HardTalk series. 


Climate change danger assessment

The image below, earlier discussed here, expands risk assessment beyond its typical definition as the product of the severity of impact and probability of occurrence, by adding a third dimension: timescale, in particular imminence.


Conclusion

Imminence alone could make that the danger constituted by rising temperatures needs to be acted upon immediately, comprehensively and effectively. While questions may remain regarding probability, severity and timescale of the dangers associated with climate change, the precautionary principle should prevail and this should prompt for action, i.e. comprehensive and effective action to reduce damage and improve the situation is imperative and must be taken as soon as possible. To combat rising temperatures, transforming society is needed, along the lines of this 2022 post in combination with declaration of a climate emergency.

Accordingly, everyone is encouraged to support and share this Climate Emergency Declaration.


Links

• Wet Bulb Globe Temperature
https://digital.mdl.nws.noaa.gov

• National Weather Service - Wet Bulb Globe Temperature: How and when to use it
https://www.weather.gov/news/211009-WBGT

• Nullschool.net
https://earth.nullschool.net

• Weather tracker: China issues heatstroke alert amid historic heatwave
https://www.theguardian.com/environment/2023/jun/23/weather-tracker-china-issues-heatstroke-alert-amid-historic-heatwave

• Peaks matter
https://arctic-news.blogspot.com/2018/08/peaks-matter.html

• It could be unbearably hot in many places within a few years time
https://arctic-news.blogspot.com/2016/07/it-could-be-unbearably-hot-in-many-places-within-a-few-years-time.html

• The emergence of heat and humidity too severe for human tolerance - by Colin Raymons et al. (2020)
https://www.science.org/doi/10.1126/sciadv.aaw1838

• Brief periods of dangerous humid heat arrive decades early

• Evaluating the 35°C wet-bulb temperature adaptability threshold for young, healthy subjects (PSU HEAT Project) - by Daniel Vecellio et al. (2022) 

• Co-extinctions annihilate planetary life during extreme environmental change, by Giovanni Strona and Corey Bradshaw (2018)
https://www.nature.com/articles/s41598-018-35068-1

• Jet Stream
https://arctic-news.blogspot.com/p/jet-stream.html

• When Will We Die?
https://arctic-news.blogspot.com/2019/06/when-will-we-die.html

• Copernicus - Biomass-burning aerosols
https://atmosphere.copernicus.eu/charts/packages/cams/products/aerosol-forecasts

• Extinction
https://arctic-news.blogspot.com/p/extinction.html

• Will there be Arctic sea ice left in September 2023?
https://arctic-news.blogspot.com/2023/05/will-there-be-arctic-sea-ice-left-in-september-2023.html

• Clausius–Clapeyron relation
https://en.wikipedia.org/wiki/Clausius–Clapeyron_relation

• Urban heat island
https://en.wikipedia.org/wiki/Urban_heat_island

• Heat dome
https://en.wikipedia.org/wiki/Heat_dome

• ESA - Heatwave across India
https://www.esa.int/ESA_Multimedia/Images/2022/04/Heatwave_across_India

• Evaporative Demand Increase Across Lower 48 Means Less Water Supplies, Drier Vegetation, and Higher Fire Risk
https://www.drought.gov/news/evaporative-demand-increase-across-lower-48-means-less-water-supplies

• A Multidataset Assessment of Climatic Drivers and Uncertainties of Recent Trends in Evaporative Demand across the Continental United States - by Christine Albano et al. (2022)
https://arctic-news.blogspot.com/2022/04/carbon-dioxide-crosses-422-ppm.html

• 559 million children currently exposed to high heatwave frequency, rising to all 2.02 billion children globally by 2050
https://www.unicef.org/press-releases/heatwaves-report

• Copernicus - Scorching heatwave hits Spain 
https://www.copernicus.eu/en/media/image-day-gallery/scorching-heatwave-hits-spain

• NASA - custom plots 
https://data.giss.nasa.gov/gistemp/graphs_v4/customize.html

• Climate Reanalyzer - World Daily 2-meter Air Temperature (90-90°N, 0-360°E)
https://climatereanalyzer.org/clim/t2_daily

• NOAA - Solar cycle sunspot number progression
https://www.swpc.noaa.gov/products/solar-cycle-progression

• A Strong 2023/24 El Niño is Staged by Tropical Pacific Ocean Heat Content Buildup - by Tao Lian et al. (2023)


Wednesday, June 7, 2023

Smoke over North America


High levels of biomass-burning aerosols show up over North America on the above June 7, 2023 06 UTC forecast by Copernicus.


The above satellite image shows the US East Coast, with New York blanketed in a veil of smoke on June 7, 2023.   


High levels of carbon monoxide are visible over North America on the above map. Carbon monoxide is forecast to be as high as 8715 parts per billion in Quebec, Canada on June 8, 2023 (at 12:00 UTC, a few hours from now, at the green circle).

The map below shows the location for this measurement in Quebec, Canada on June 8, 2023 (at red marker). 


The image below also shows wind at 250 hPa, i.e. the Jet Stream. The circular wind patterns indicate how deformed the Jet Stream is. 


The image below, from an earlier post, further illustrates the extent of the deformation of the Jet Stream, showing the Jet Stream on June 6, 2023, with no less than 26 circular wind patterns (at 250 hPa) marked on the image, which also shows sea surface temperature anomalies. The Jet Stream is also crossing the Equator.


As an update, below is a forecast of biomass-burning aerosols for June 14, 2023. 


Links

• Copernicus
https://atmosphere.copernicus.eu

• Nullschool
https://earth.nullschool.net

• Google maps
https://earth.nullschool.net

• Fire
https://arctic-news.blogspot.com/p/fire.html

• Jet Stream
https://arctic-news.blogspot.com/p/jet-stream.html

• Feedbacks in the Arctic
https://arctic-news.blogspot.com/p/feedbacks.html

Tuesday, August 3, 2021

Climate Change Henchmen: Storm, Flood, Heat, Smoke and Fire

As climate change strikes with ever greater ferocity, five henchmen dominate the news: Storm, Flood, Heat, Smoke and Fire.


During the first 6 months of 2021, there have been 8 separate billion-dollar weather and climate disaster events across the United States. The U.S. has sustained 298 weather and climate disasters since 1980 where overall damages/costs reached or exceeded $1 billion (including CPI adjustment to 2020). The total cost of these 298 events exceeds $1.975 trillion. The total cost over the last 5 complete years (2016-2020) exceeds $630.0 billion — averaging more than $125.0 billion/year — both new records.

The image on the right shows very high temperatures over North America end July 2021, with fire radiative power as high as 247.3 MW.

The NASA Worldview satellite image below shows large smoke plumes on July 7, 2021, reaching Hudson Bay. Furthermore, large smoke plumes are also visible over British Columbia.


The NASA Worldview satellite image below shows smoke traveling from the West Coast to the East Coast of the U.S. on July 26, 2021.


The Copernicus image on the right shows Siberian fires spreading aerosols over the Arctic Ocean on August 2, 2021 

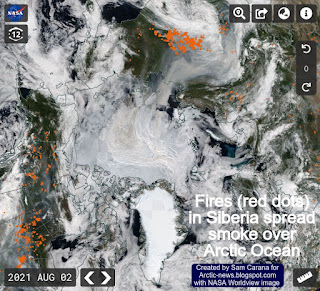
The NASA Worldview satellite image underneath on the right shows fires (red dots) in Siberia spreading smoke over the Arctic Ocean on August 2, 2021. 

Mainstream media do cover such disasters, often with sensational footage and while pointing at the extensive damage and loss of life caused by such events. 

However, mainstream media rarely point out that climate change is getting worse and and even more so due to feedbacks that can amplify extreme weather events and can further speed up how climate change unfolds.

One of these feedbacks is albedo loss, i.e. decline of the snow and ice cover resulting in less sunlight getting reflected back into space. Fires also come with soot that can settle on snow and ice, resulting in surface darkening that will speed up melting and albedo loss. 

The rapid thinning of Arctic sea ice was discussed in an earlier post and is again illustrated by the image on the right.

The image shows the sea ice (or rather the lack of it) north of Greenland on August 15, 2021. This is where years ago the thickest sea ice was located.

The melt season will continue for at least another month time, so the situation is very worrying, since the disappearance of the thicker sea ice means that the buffer is gone, i.e. that the latent heat tipping point of Arctic sea ice has been crossed.

Here's a link to compare the sea ice north of Greenland between July 29, 2021, and August 15, 2021.

The NSIDC image on the right shows that the proportion of multiyear ice in the Arctic during the first week of August was at 1.6 million km² (618,000 million miles²).

NSIDC adds: The loss of the multiyear ice since the early 1980s started in earnest after the 2007 record low minimum sea ice cover that summer, and while there have been slight recoveries since then, it has not recovered to values seen in the 1980s, 1990s, or early 2000s. This loss of the oldest and thickest ice in the Arctic Ocean is one of the reasons why the summer sea ice extent has not recovered, even when weather conditions are favorable for ice retention.

The Naval Research Lab animation on the right shows Arctic sea ice thickness (in m) for the 30 days up to August 27, 2021, with eight days of forecasts included. 

As the temperature difference between the North Pole and the Equator narrows, the wind flowing north on the Northern Hemisphere slows down, which changes the Jet Stream, resulting in more extreme weather events, including heatwaves and fires. 

One of the most dangerous feedbacks is that, as temperatures of the water of the Arctic Ocean keeps rising, more heat will reach sediments under the Arctic Ocean where huge amounts of methane are stored, causing destabilization. 

[ from the feedbacks page ]
This destabilization threatens to cause huge quantities of methane to erupt and enter the atmosphere, as has been discussed in many earlier posts such as this one and this one

This threat becomes dramatically larger as the latent heat threshold gets crossed and the buffer constituted by Arctic sea ice disappears, so further heat entering the Arctic Ocean from the Atlantic Ocean and the Pacific Ocean can no longer be consumed in the process of melting the subsurface sea ice. 

Ominously, the MetOp-2 satellite recorded a methane level of 2839 ppb at 469 mb on July 30, 2021 pm, as the image on the right shows.

[ peak methane level of 2839 ppb ]
The image underneath shows large quantities of methane over the East Siberian Arctic Shelf (ESAS) at 469 mb on August 4, 2021 pm. 

On August 4, 2021, there still was some sea ice present in the ESAS. While this remaining sea ice does prevent a lot of sunlight from reaching the water and heating it up, the sea ice also acts as a seal, preventing ocean heat from getting transferred to the atmosphere. The water in the ESAS is very shallow, less than 50 meter in most places, which makes it easier for heat to reach sediments, while it also makes it harder for methane that is rising through the water column to get decomposed by microbes in the water.

[ large quantities of methane over ESAS ]
The image underneath shows that on August 4, 2021 am, at 293 mb, the MetOp-1 satellite recorded a mean global methane level of 1942 ppb. 

At a 1-year Global Warming Potential (GWP) of 200, this translates into 388.2 ppm CO₂e. By comparison, the CO₂ level on August 4, 2021, was 414.89 ppm according to the Keeling Curve measurements at Mauna Loa, Hawaii. A GWP of 200 for methane is appropriate in the light of the danger of a huge burst of methane erupting from the seafloor of the Arctic Ocean, which would, due to the abrupt nature of such an eruption, make its impact felt instantaneously. 

[ mean global methane level of 1941 ppb ]
Methane levels are already very high over the Arctic, so additional methane erupting there will be felt most strongly in the Arctic itself, thus threatening to trigger even further methane releases.

The situation is dire and calls for immediate, comprehensive and effective action as described in the Climate Plan.


Links


• NOAA Billion-Dollar Weather and Climate Disasters: Time Series

• Copernicus - aerosols

• MetOp methane levels

• NSIDC: Arctic Sea Ice News & Analysis - August 18, 2021

• Heatwaves and the danger of the Arctic Ocean heating up 
https://arctic-news.blogspot.com/2021/06/heatwaves-and-the-danger-of-the-arctic-ocean-heating-up.html

• Arctic sea ice disappearing fast

• When will we die?

• Most Important Message Ever


Wednesday, January 15, 2020

The Australian firestorms: portents of a planetary future

by Andrew Glikson
Earth and climate scientist
Australian National University

Global warming and its disastrous consequences are now truly with us since the second part of 2019. At the moment a change in the weather has given parts of the country a respite from the raging fires, some of which are still burning or smoldering, waiting for another warm spell to flare up. The danger zones include the Australian Capital Territory, from where these lines are written. To date, 18.6 million hectares (186,000 square kilometers) were burnt, including native forests, native animals, homesteads and towns, and 24 people died. The firestorms betray harbingers of a planetary future, or a lack of such, under ever rising temperatures and extreme weather events inherent in fossil fuel driven global warming.

Global heating

As the atmospheric concentration of the well-mixed greenhouse gases rise (CO₂ >411.76 ppm; CH₄ >1870.5 ppb; N₂O >333 ppb plus trace greenhouse gases) land temperatures soar (NASA global sea-land mean of 1.05°C since 1880). According to Berkeley Earth global land temperatures have increased by 1.5C over the past 250 years and mean Arctic temperatures have risen by 2.5°C to 3.0°C between 1900 and 2017. According to NASA :
  1. “Extreme heatwaves will become widespread at 1.5 degrees Celsius warming. Most land regions will see more hot days, especially in the tropics.
  2. At 1.5°C about 14 percent of Earth’s population will be exposed to severe heatwaves at least once every five years, while at 2 degrees Celsius warming that number jumps to 37 percent.”
  3. “Risks from forest fires, extreme weather events and invasive species are higher at 2 degrees warming than at 1.5 degrees warming.”
  4. “Ocean warming, acidification and more intense storms will cause coral reefs to decline by 70 to 90 percent at 1.5 degrees Celsius warming, becoming all but non-existent at 2 degrees warming.”
Figure 1. The distribution of global fires. NASA.

However, bar the transient masking effects of sulphur aerosols, which according to estimates by Hansen et al. (2011) induce more than 1.0°C of cooling, global temperatures have already reached near 2.0°C (by analogy to the requirement for a patient’s body temperature to be measured before and not after aspirin has been taken). As aerosols are not homogeneously distributed, in some parts of the world temperatures have already soared to such levels. Thus the degree to which aerosols cool the earth, which depends on aerosol particle size range, has been grossly underestimated.

The rate of global warming, at ~2 to 3 ppm year and ~1.5°C in about one century, faster by an order of magnitude then geological climate catastrophe such as the PETM and the KT impact, has taken scientists by surprise, requiring a change from the term climate change to climate calamity.

The Australian firestorms

In Australia mean temperatures have risen by 1.5°C between 1910 and 2019 (Figure 2), as a combination of global warming and the ENSO conditions, as reported by the Bureau of Meteorology.

“The Indian Ocean Dipole (IOD) has returned to neutral after one of the strongest positive IOD events to impact Australia in recent history ... the IOD’s legacy of widespread warm and dry conditions during the second half of 2019 primed the Australian landscape for bushfire weather and heatwaves this summer. In the Pacific Ocean, although indicators of the El Niño–Southern Oscillation (ENSO) are neutral, the tropical ocean near and to the west of the Date Line remains warmer than average, potentially drawing some moisture away from Australia.”

Figure 2. (A) Australian mean temperature. (B) Severe fire weather. (C) Drought. (D) Driest year.
Bureau of Meteorology
The prolonged drought (Figure 2 C, D), low fuel moisture, high temperatures (Figure 2A) and warm winds emanating from the inland have rendered large parts of the Australian continent tinder dry, creating severe fire weather (Figure 2B) subject to ignition by lightning and human factors. Fires on a large scale create their own weather (see: bushfire raging in Mount Adrah and firestorm). Observations of major conflagrations, including the 2003 Canberra fires, indicate fires can form atmospheric plumes which can migrate and as hot plumes radiating toward the ground (fire tornadoes).

The underlying factor for rising temperatures and increasingly severe droughts in Australia is the polar-ward shift in climate zones (see map Oceania) as the Earth warms, estimated as approximately 56-111 km per decade, where dry hot subtropical zones encroach into temperate zones, as is also the case in South Africa and the Sahara.

Smoke signals emanating from the Australian fires are now circling around the globe (Figure 3) signaling a warning of the future state of Earth should Homo sapiens, so called, not wake up to the consequences of its actions.

Figure 3. (A) Smoke emanating from the southeastern Australian fires (January 4, 2020);
(B) smoke from the pyro-cumulonimbus clouds of the Australian fires drifting across the Pacific Ocean.
The fire clouds have lofted smoke to unusual heights in the atmosphere. The CALIPSO satellite observed smoke soaring between 15 to 19 kilometers on January 6, 2020—high enough to reach the stratosphere. NASA.


Andrew Glikson
Dr Andrew Glikson
Earth and climate scientist
Australian National University


Sunday, July 1, 2018

Can we weather the Danger Zone?

[ click on image to enlarge ]
As an earlier Arctic-news analysis shows, Earth may have long crossed the 1.5°C guardrail set at the Paris Agreement.

Earth may have already been in the Danger Zone since early 2014. This is shown by the image on the right associated with the analysis, which is based on NASA data that are adjusted to reflect a preindustrial baseline, air temperatures and Arctic temperatures.

As the added 3rd-order polynomial trend shows, the world may also be crossing the higher 2°C guardrail later this year, while temperatures threaten to keep rising dramatically beyond that point.

What is the threat?

As described at the Threat, much carbon is stored in large and vulnerable pools that have until now been kept stable by low temperatures. The threat is that rapid temperature rise will hit vulnerable carbon pools hard, making them release huge amounts of greenhouse gases, further contributing to the acceleration of the temperature rise.


Further release of greenhouse gases will obviously further speed up warming. In addition, there are further warming elements that could result in very rapid acceleration of the temperature rise, as discussed at the Extinction page.

The Danger Zone

Below are some images illustrating just how dire the situation is, illustrating how vulnerable carbon pools are getting hit exactly as feared they would be with a further rise in temperature.

On July 5, 2018, it was as hot as 33.5°C or 92.3°F on the coast of the Arctic Ocean in Siberia (at top green circle, at 72.50°N). Further inland, it was as hot as 34.2°C or 93.5°F (at bottom green circle, at 68.6°N).


The satellite image below shows smoke from fires over parts of Siberia hit strongly by heat waves.


The fires caused carbon monoxide levels as high as 20,309 ppb over Siberia on July 3, 2018.


Methane levels that day were as high as 2,809 ppb.


On July 4, 2018, forest fires near the Lena River cause smoke over the Laptev Sea and East Siberian Sea. CO (see inset) and CO₂ levels that day were as high as 45080 ppb and 724 ppm (at the green circle), as illustrated by the image below.


The Copernicus image below shows aerosol forecasts for July 4, 2018, 21:00 UTC, due to biomass burning.


Another Copernicus forecast shows high ozone levels over Siberia and the East Siberian Sea.


EPA 8-hour ozone standard is 70 ppb and here's a report on recent U.S. ozone levels. See Wikipedia for more on the strong local and immediate warming impact of ozone and how it also makes vegetation more vulnerable to fires.

The global 10-day forecast (GFS) below, run on July 3, 2018, with maximum 2 meter temperature, shows that things may get even worse over the coming week or more.


Could we move out of the Danger Zone?

What can be done to improve this dire situation?

One obvious line of action is to make more effort to reduce emissions that are causing warming. There's no doubt that this can be achieved and has numerous benefits, as described in an earlier post. Emission cuts can be achieved by implementing effective policies to facilitate changes in energy use, in diet and in land use and construction practices, etc.

One complication is that the necessary transition away from fossil fuel is unlikely to result in immediate falls in temperatures. This is the case because there will be less sulfur in the atmosphere to reflect sunlight back into space. Furthermore, there could also be an increase in biomass burning, as discussed at the Aerosols page, while the full wrath of recent carbon dioxide emissions is yet to come. As said, the resulting rise in temperature threatens to trigger numerous feedbacks that could accelerate the temperature rise even further. For more on how much temperatures could rise, see the Extinction page.

While it's clear that - besides emission cuts - further action is necessary, such as removing greenhouse gases from the atmosphere and oceans, the prospect is that such removal will have to continue for decades and decades to come before it can bring greenhouse gases down to safer levels. To further combat warming, there are additional lines of action to be looked at, but as long as politicians remain reluctant to even consider pursuing efforts to reduce emissions, we can expect that the world will be in the Danger Zone for a long time to come.

The situation is dire and calls for comprehensive and effective action, as described in the Climate Plan.


Links

• How much warmer is it now?
https://arctic-news.blogspot.com/2018/04/how-much-warmer-is-it-now.html

• 100% clean, renewable energy is cheaper
https://arctic-news.blogspot.com/2018/02/100-clean-renewable-energy-is-cheaper.html

• Feedbacks
https://arctic-news.blogspot.com/p/feedbacks.html

• How much warming have humans caused?
https://arctic-news.blogspot.com/2016/05/how-much-warming-have-humans-caused.html

• IPCC seeks to downplay global warming
https://arctic-news.blogspot.com/2018/02/ipcc-seeks-to-downplay-global-warming.html

• The Threat
https://arctic-news.blogspot.com/p/threat.html

• Extinction
https://arctic-news.blogspot.com/p/extinction.html

• Aerosols
https://arctic-news.blogspot.com/p/aerosols.html

• How extreme will it get?
https://arctic-news.blogspot.com/2012/07/how-extreme-will-it-get.html

• Climate Plan
https://arctic-news.blogspot.com/p/climateplan.html